Load Testing Guide
This document describes how to run load tests and validate performance baselines for the GLM Proxy.
Related:
- Monitoring Guide - Health checks and stats endpoints
- Architecture - System components and data flow
- Z.ai Knowledge Base - Provider-specific rate limits
- Testing Guide - Test strategy and coverage
Dashboard Monitoring During Load Tests
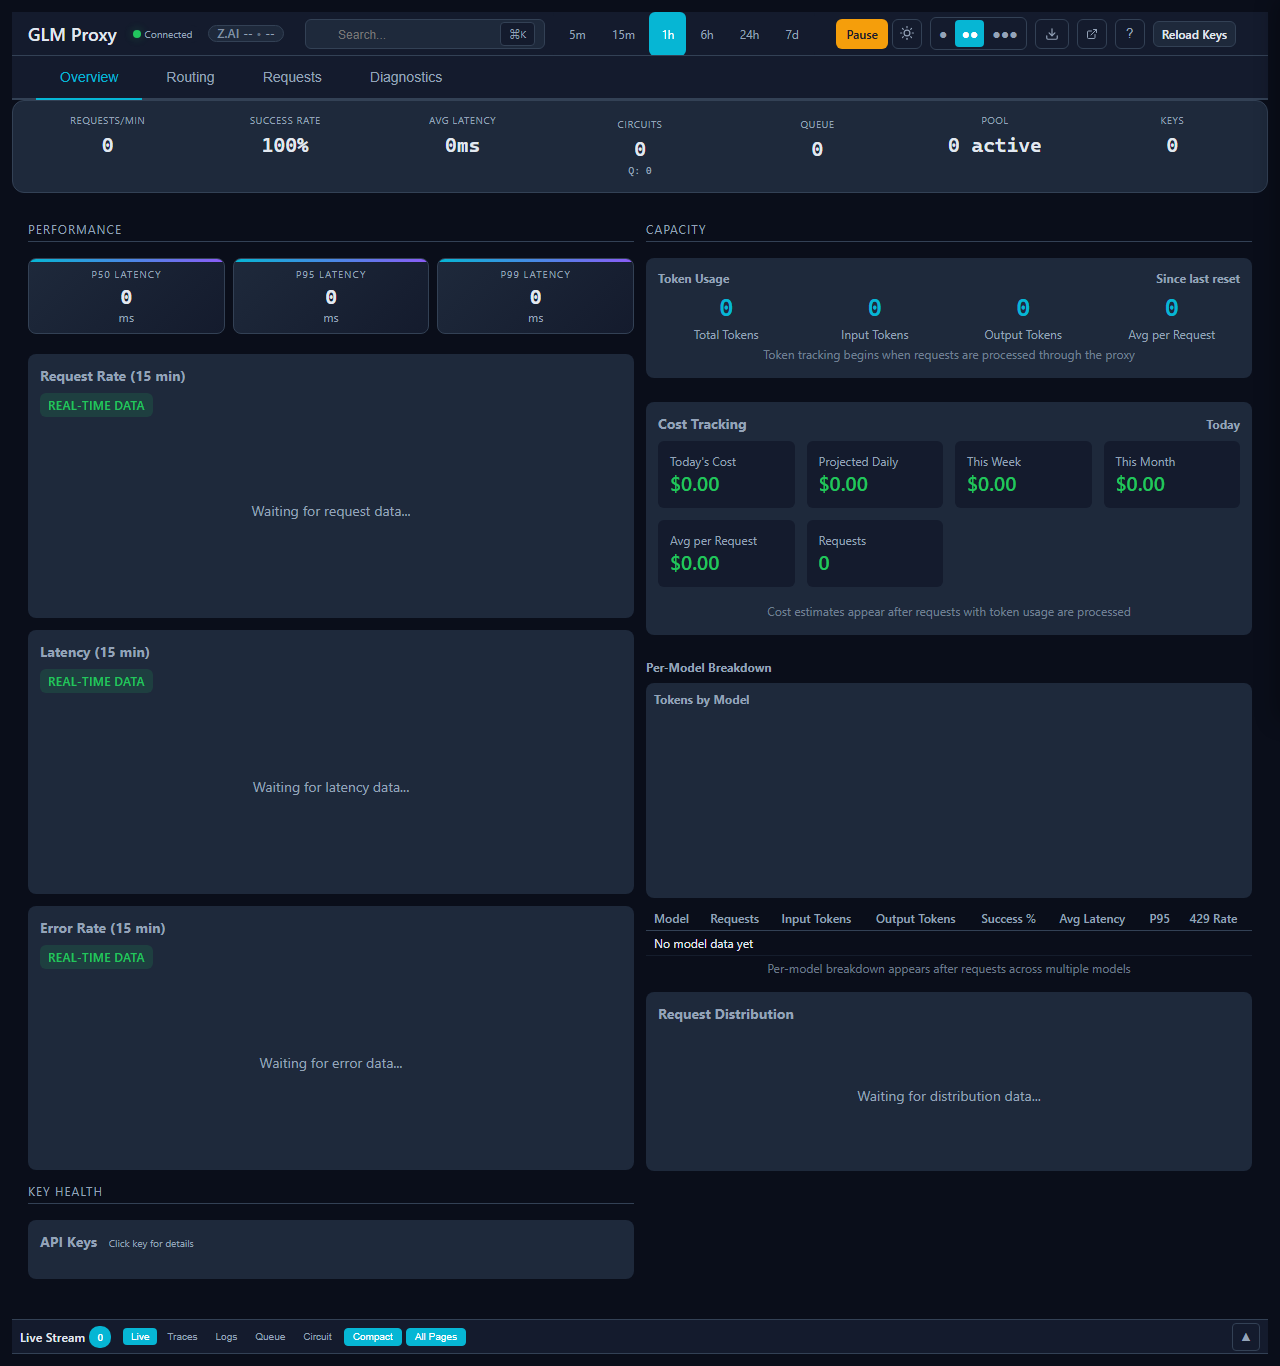
The dashboard provides real-time visibility into system performance during load tests. Key sections to monitor:
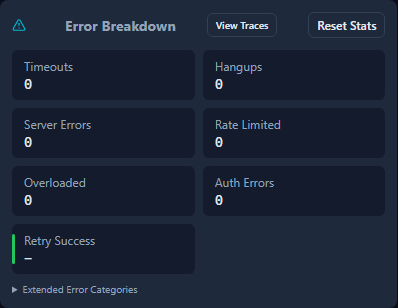
Error Breakdown - View error types during load tests:
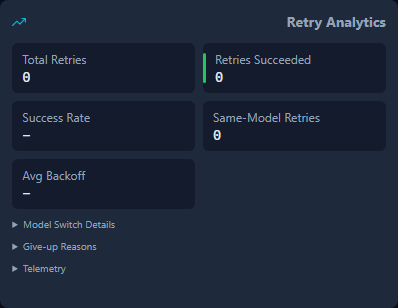
Retry Analytics - Monitor retry behavior under load:
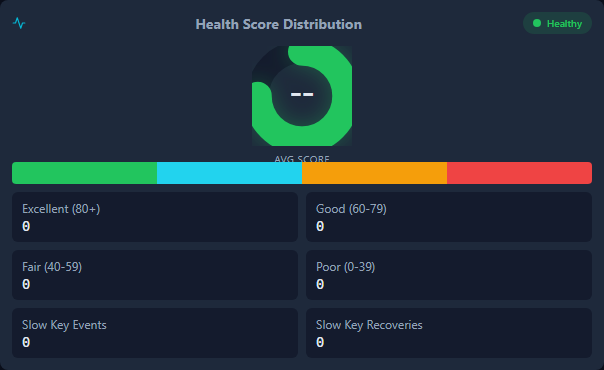
Health Score - Track overall system health:
Quick Start
# Run a quick smoke test (30s, 5 RPS)
npm run baseline:smoke

# Run a standard load test (2min, 20 RPS)
npm run baseline:standard

# Run a stress test (5min, 50 RPS)
npm run baseline:stress
Performance Baselines
Baselines are defined in config/performance-baseline.json. Each profile specifies:
- Duration: How long to run the test
- RPS: Target requests per second
- Concurrency: Maximum concurrent requests
- Warmup: Seconds to warm up before measuring
- Thresholds: Pass/fail criteria
Available Profiles
| Profile | Duration | RPS | Use Case |
|---|---|---|---|
| smoke | 30s | 5 | Quick CI validation |
| standard | 120s | 20 | Regression detection |
| stress | 300s | 50 | Capacity planning |
| soak | 1hr | 10 | Memory leak detection |
Threshold Categories
- Latency (milliseconds)
- P50: Median response time
- P95: 95th percentile
- P99: 99th percentile
- Throughput
- Minimum requests per second
- Errors
- Maximum error rate (percentage)
- Memory
- Maximum heap usage (MB)
- Maximum leak rate (MB/minute)
Running Tests
Prerequisites
-
Start the proxy server:
npm start -
Ensure you have API keys configured in your
.envorkeys.txt
Basic Load Test
# Custom load test with the load.js script
node scripts/load.js --rps=10 --duration=60 --verbose
Baseline Validation
# Validate against smoke baseline (exits with code 1 if failed)
npm run baseline:smoke

# Save results to file
node scripts/validate-baseline.js smoke --output=results.json

# Run against custom target
node scripts/validate-baseline.js standard --target=http://proxy.example.com:3000
Stress Tests with Jest
# Run all stress tests
npm run test:stress

# Run specific baseline tests
npm run test:stress -- baseline.test.js
Interpreting Results
Success Output
========================================
Results Summary
========================================
Total Requests: 150
Successful: 145
Failed: 5
Error Rate: 3.33%
Throughput: 5.12 RPS
Latency P50: 1234ms
Latency P95: 3456ms
Latency P99: 5678ms
Max Heap: 256MB
----------------------------------------

Baseline Checks:
  ✓ PASS: Latency P50 (expected: <5000ms, actual: 1234ms)
  ✓ PASS: Latency P95 (expected: <15000ms, actual: 3456ms)
  ✓ PASS: Throughput (expected: >3 RPS, actual: 5.12 RPS)
  ✓ PASS: Error Rate (expected: <10%, actual: 3.33%)

========================================
✓ ALL BASELINE CHECKS PASSED
========================================
Failure Output
Baseline Checks:
  ✓ PASS: Latency P50 (expected: <5000ms, actual: 1234ms)
  ✗ FAIL: Latency P95 (expected: <15000ms, actual: 18000ms)
  ✗ FAIL: Throughput (expected: >3 RPS, actual: 2.1 RPS)
  ✓ PASS: Error Rate (expected: <10%, actual: 3.33%)

========================================
✗ BASELINE VALIDATION FAILED
========================================
CI Integration
Add baseline validation to your CI pipeline:
# Example GitHub Actions
test:
  runs-on: ubuntu-latest
  steps:
    - uses: actions/checkout@v4
    - run: npm install
    - run: npm start &
    - run: sleep 5  # Wait for server to start
    - run: npm run baseline:ci
Updating Baselines
When performance improves, update the baseline thresholds:
- Run a standard baseline test to get current metrics
- Update
config/performance-baseline.jsonwith new thresholds - Add a buffer (e.g., 20%) above current metrics for variability
- Document the change with date and reason
Example update:
{
  "latency": {
    "p50": 3000,  // Was 5000, improved due to connection pooling
    "p95": 10000,
    "p99": 20000
  }
}
Troubleshooting
High Latency
- Check if upstream API is slow
- Verify connection pooling is working
- Look for circuit breaker trips
- Check for rate limiting
High Error Rate
- Check API key validity
- Look for rate limit errors (429)
- Verify upstream availability
- Check backpressure queue
Using Z.ai? See Z.ai Knowledge Base for understanding quota limits and Model Concurrency Findings for Z.ai-specific concurrency behavior.
Memory Growth
- Run soak test to confirm leak
- Check for event listener leaks
- Verify request cleanup
- Profile with
--inspect
Advanced Usage
Custom Profiles
Add custom profiles to config/performance-baseline.json:
{
  "profiles": {
    "my-custom": {
      "description": "Custom test for specific use case",
      "duration": 60,
      "rps": 15,
      "concurrency": 15,
      "warmup": 10,
      "thresholds": {
        "latency": { "p95": 8000 },
        "errors": { "maxRate": 5 }
      }
    }
  }
}
Programmatic Access
const { makeRequest, percentile } = require('./scripts/load');

async function customTest() {
  const results = [];
  for (let i = 0; i < 100; i++) {
    results.push(await makeRequest());
  }
  console.log('P95:', percentile(results.map(r => r.latency), 95));
}
Metrics Reference
| Metric | Description | Source |
|---|---|---|
| requests.total | Total requests sent | Load script |
| requests.success | Successful responses (2xx) | Load script |
| latency.p50 | Median response time | Calculated |
| latency.p95 | 95th percentile latency | Calculated |
| throughput.rps | Requests per second | Calculated |
| errors.rate | Error percentage | Calculated |
| memory.heapUsed | V8 heap memory | process.memoryUsage() |
| memory.rss | Resident set size | process.memoryUsage() |