Monitoring
Guide for monitoring GLM Proxy health and performance.
Related:
- Dashboard Guide - Visual dashboard tour and features
- Configuration Guide - Environment variables and settings
- Z.ai Documentation - Understanding quotas, rate limits, and tier capabilities
- Metrics Reference - Prometheus metrics definitions
- Events SSE Contract - Real-time event streaming
Dashboard Monitoring
The dashboard provides real-time visual monitoring of all proxy metrics. Open it at http://127.0.0.1:18765/dashboard.
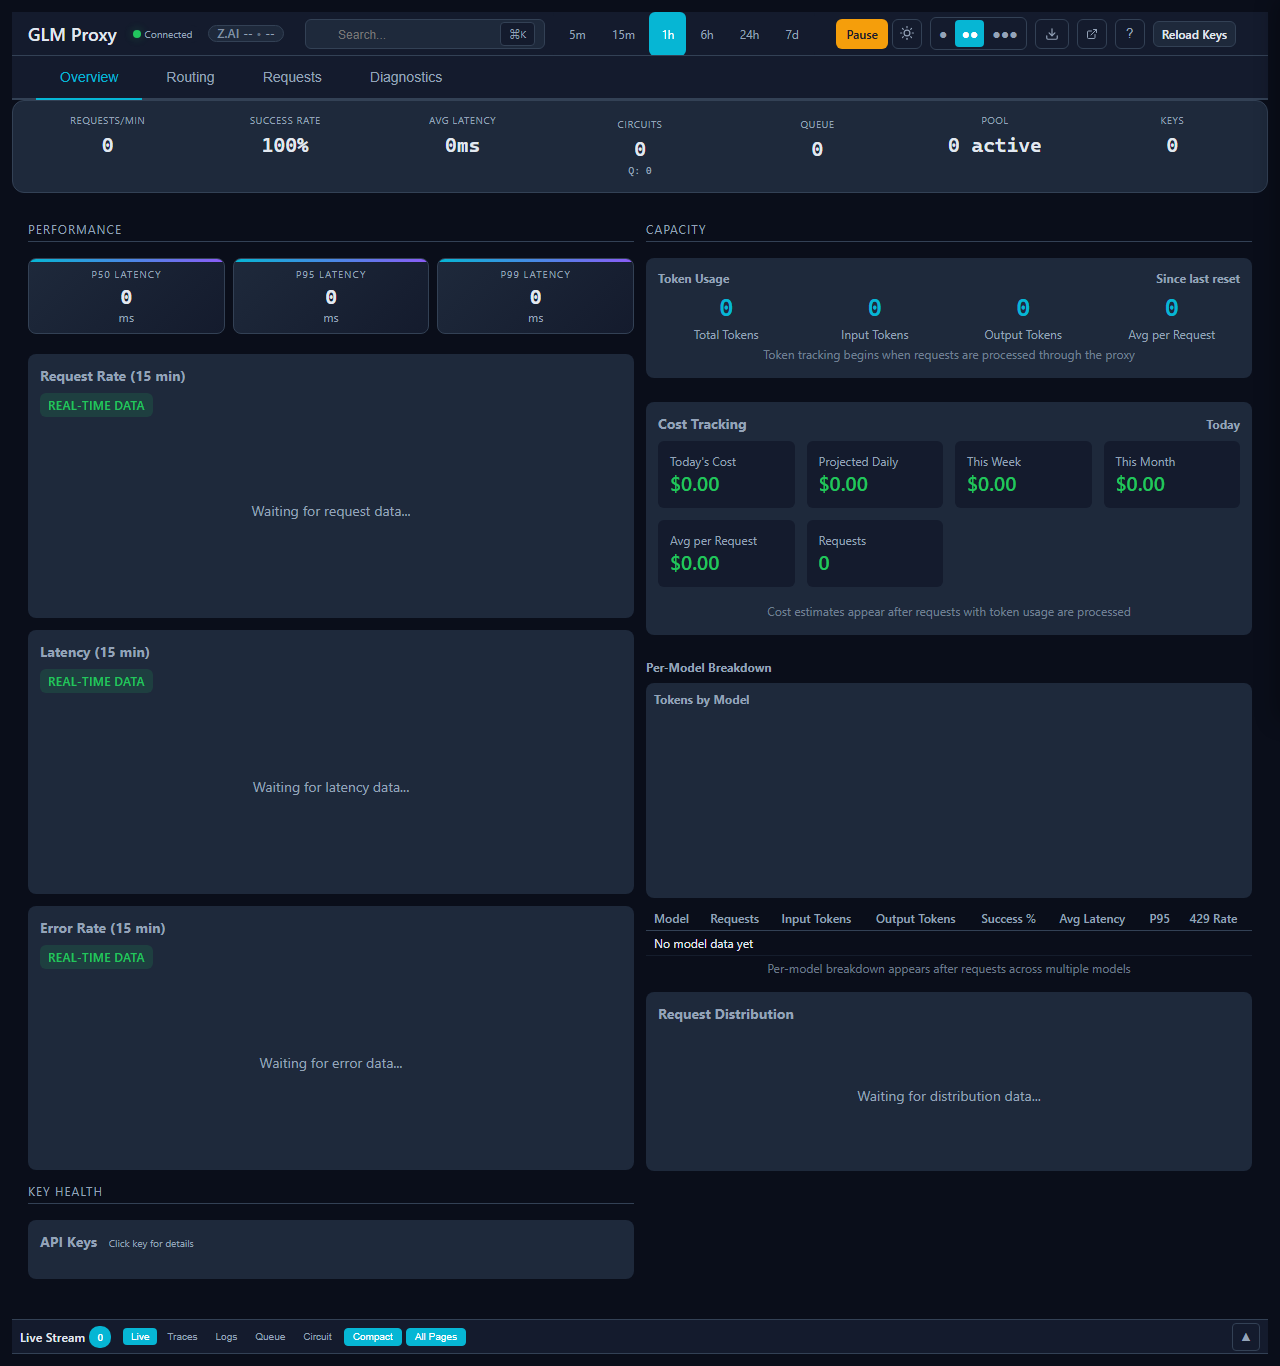
Key Monitoring Sections
Connection Status - See if the proxy is connected to the upstream API:

Keys Heatmap - Monitor the health of all your API keys at a glance:

- Green cells = healthy keys
- Yellow/Red cells = degraded or failing keys
- Pulsing cells = active requests
Request Charts - Track request rate and latency over time:


Circuit Breaker Status - Monitor circuit breaker states for all keys:

Health Ribbon - Quick overview of system health at the top of the dashboard:

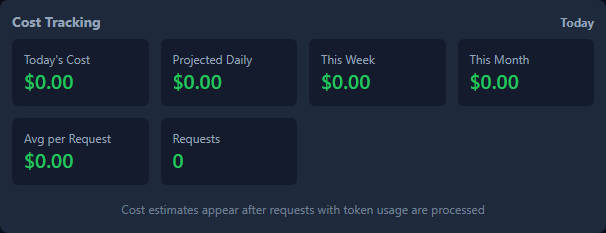
Cost Panel - Track token usage and costs in real-time:
API Endpoints
| Endpoint | Description |
|---|---|
GET /health |
Health check with key status |
GET /stats |
Real-time statistics |
GET /persistent-stats |
Historical usage statistics |
GET /backpressure |
Current load information |
POST /reload |
Trigger hot reload of API keys |
GET /adaptive-concurrency |
AIMD window snapshot |
PUT /adaptive-concurrency |
Toggle AIMD mode |
Health Check
Check proxy health and key status:
curl http://127.0.0.1:18765/health
Response:
{
  "status": "OK",
  "healthyKeys": 5,
  "totalKeys": 5,
  "uptime": 3600,
  "backpressure": {
    "current": 2,
    "max": 200,
    "available": 198,
    "percentUsed": 1
  }
}
Fields
| Field | Description |
|---|---|
status |
Overall health status (OK or DEGRADED) |
healthyKeys |
Number of healthy API keys |
totalKeys |
Total number of configured keys |
uptime |
Uptime in seconds |
backpressure |
Current backpressure information |
Real-time Statistics
View detailed real-time statistics:
curl http://127.0.0.1:18765/stats
Response:
{
  "uptime": 3600,
  "uptimeFormatted": "1h 0m 0s",
  "totalRequests": 1500,
  "requestsPerMinute": 25.0,
  "successRate": 99.3,
  "activeConnections": 3,
  "latency": {
    "avg": 1245,
    "min": 296,
    "max": 5420,
    "spread": 18.3,
    "samples": 1492
  },
  "keys": [
    {
      "index": 0,
      "state": "CLOSED",
      "inFlight": 1,
      "total": 300,
      "successes": 298,
      "successRate": 99.3,
      "failures": 2,
      "latency": {
        "avg": 1200,
        "min": 312,
        "max": 4521,
        "p50": 1050,
        "p95": 2800,
        "p99": 4100,
        "samples": 100
      }
    }
  ],
  "errors": {
    "timeouts": 1,
    "socketHangups": 0,
    "dnsErrors": 0,
    "tlsErrors": 0,
    "clientDisconnects": 0,
    "rateLimited": 0,
    "totalRetries": 5,
    "retriesSucceeded": 3,
    "retrySuccessRate": 60.0
  },
  "queue": {
    "current": 0,
    "max": 100,
    "available": 100,
    "percentUsed": 0,
    "metrics": {
      "totalEnqueued": 10,
      "totalDequeued": 10,
      "totalTimedOut": 0,
      "peakSize": 3
    }
  }
}
Key Metrics
| Metric | Description |
|---|---|
uptime |
Uptime in seconds |
totalRequests |
Total requests processed |
requestsPerMinute |
Current requests per minute |
successRate |
Overall success rate percentage |
activeConnections |
Currently active connections |
Latency Metrics
| Field | Description |
|---|---|
avg |
Average latency in milliseconds |
min |
Minimum latency |
max |
Maximum latency |
p50 |
50th percentile (median) |
p95 |
95th percentile |
p99 |
99th percentile |
Error Metrics
| Field | Description |
|---|---|
timeouts |
Number of timeout errors |
socketHangups |
Socket hangup errors |
dnsErrors |
DNS resolution errors |
tlsErrors |
TLS handshake errors |
clientDisconnects |
Client disconnections |
rateLimited |
Rate limit rejections |
totalRetries |
Total retry attempts |
retriesSucceeded |
Successful retries |
retrySuccessRate |
Retry success rate percentage |
Queue Metrics
| Field | Description |
|---|---|
current |
Current queue size |
max |
Maximum queue capacity |
available |
Available queue slots |
percentUsed |
Queue utilization percentage |
totalEnqueued |
Total items ever enqueued |
totalDequeued |
Total items ever dequeued |
totalTimedOut |
Total items that timed out |
peakSize |
Maximum queue size observed |
Backpressure
View current load and backpressure status:
curl http://127.0.0.1:18765/backpressure
Response:
{
  "current": 2,
  "max": 200,
  "available": 198,
  "percentUsed": 1
}
Interpreting Backpressure
| percentUsed | Status |
|---|---|
| 0-50% | Healthy |
| 50-80% | Elevated load |
| 80-95% | High load |
| 95-100% | Near capacity - consider scaling |
Adaptive Concurrency (AIMD)
The proxy uses TCP-inspired AIMD (Additive Increase / Multiplicative Decrease) to dynamically adjust per-model concurrency limits based on upstream 429 feedback.
Modes:
| Mode | Behavior |
|---|---|
observe_only |
Computes windows but does not enforce limits (safe for monitoring) |
enforce |
Applies computed limits to the key manager (active throttling) |
GET /adaptive-concurrency
Returns current AIMD state including per-model windows.
curl -H "x-admin-token: TOKEN" http://127.0.0.1:18765/adaptive-concurrency
Response includes: mode, per-model effectiveMax, staticMax, consecutiveCleanTicks, and global window state.
PUT /adaptive-concurrency
Toggle between observe_only and enforce mode at runtime.
curl -X PUT \
  -H "x-admin-token: TOKEN" \
  -H "content-type: application/json" \
  -d '{"mode": "enforce"}' \
  http://127.0.0.1:18765/adaptive-concurrency
Response: { "success": true, "previousMode": "observe_only", "currentMode": "enforce", "snapshot": {...} }
Notes:
- Requires admin authentication when enabled
- Switching to
enforceimmediately pushes computed windows to the key manager - Switching to
observe_onlyrestores static concurrency limits - Can also be set via
GLM_ADAPTIVE_CONCURRENCY_MODEenvironment variable - The dashboard AIMD card includes a toggle button for this endpoint
Persistent Statistics
View historical usage statistics:
curl http://127.0.0.1:18765/persistent-stats
Circuit Breaker Monitoring
Per-key circuit breaker state is included in /stats:
| State | Description |
|---|---|
CLOSED |
Key is healthy and accepting requests |
OPEN |
Key is disabled due to failures |
HALF_OPEN |
Key is being tested for recovery |
System Page provides detailed circuit breaker analytics:
Alerts and Monitoring
Security: See Security Configuration for admin authentication and endpoint protection. Load Testing: See Load Testing Guide for performance baseline validation.
Recommended Alerts
| Condition | Alert Level |
|---|---|
status != "OK" |
Critical |
healthyKeys < 2 |
Critical |
successRate < 95% |
Warning |
percentUsed > 80% |
Warning |
percentUsed > 95% |
Critical |
Any key state = OPEN |
Warning |
Monitoring Integration
Integrate with monitoring tools:
# Prometheus exporter example
while true; do
  curl -s http://127.0.0.1:18765/stats | jq -r '
    # Convert to Prometheus metrics format
    # ...
  '
  sleep 15
done