Month 1 Metrics: 429 Efficiency & Retry Intelligence
Metrics added to quantify retry waste, give-up behavior, model routing effectiveness, and tier downgrade impact under 429 pressure. All counters are monotonic (Prometheus counter type) and reset only on proxy restart or explicit /reset.
Related: See Model Routing for configuration details and Z.ai Knowledge Base for provider-specific rate limit behavior.
Dashboard Visualization
The System page provides visual access to key metrics:
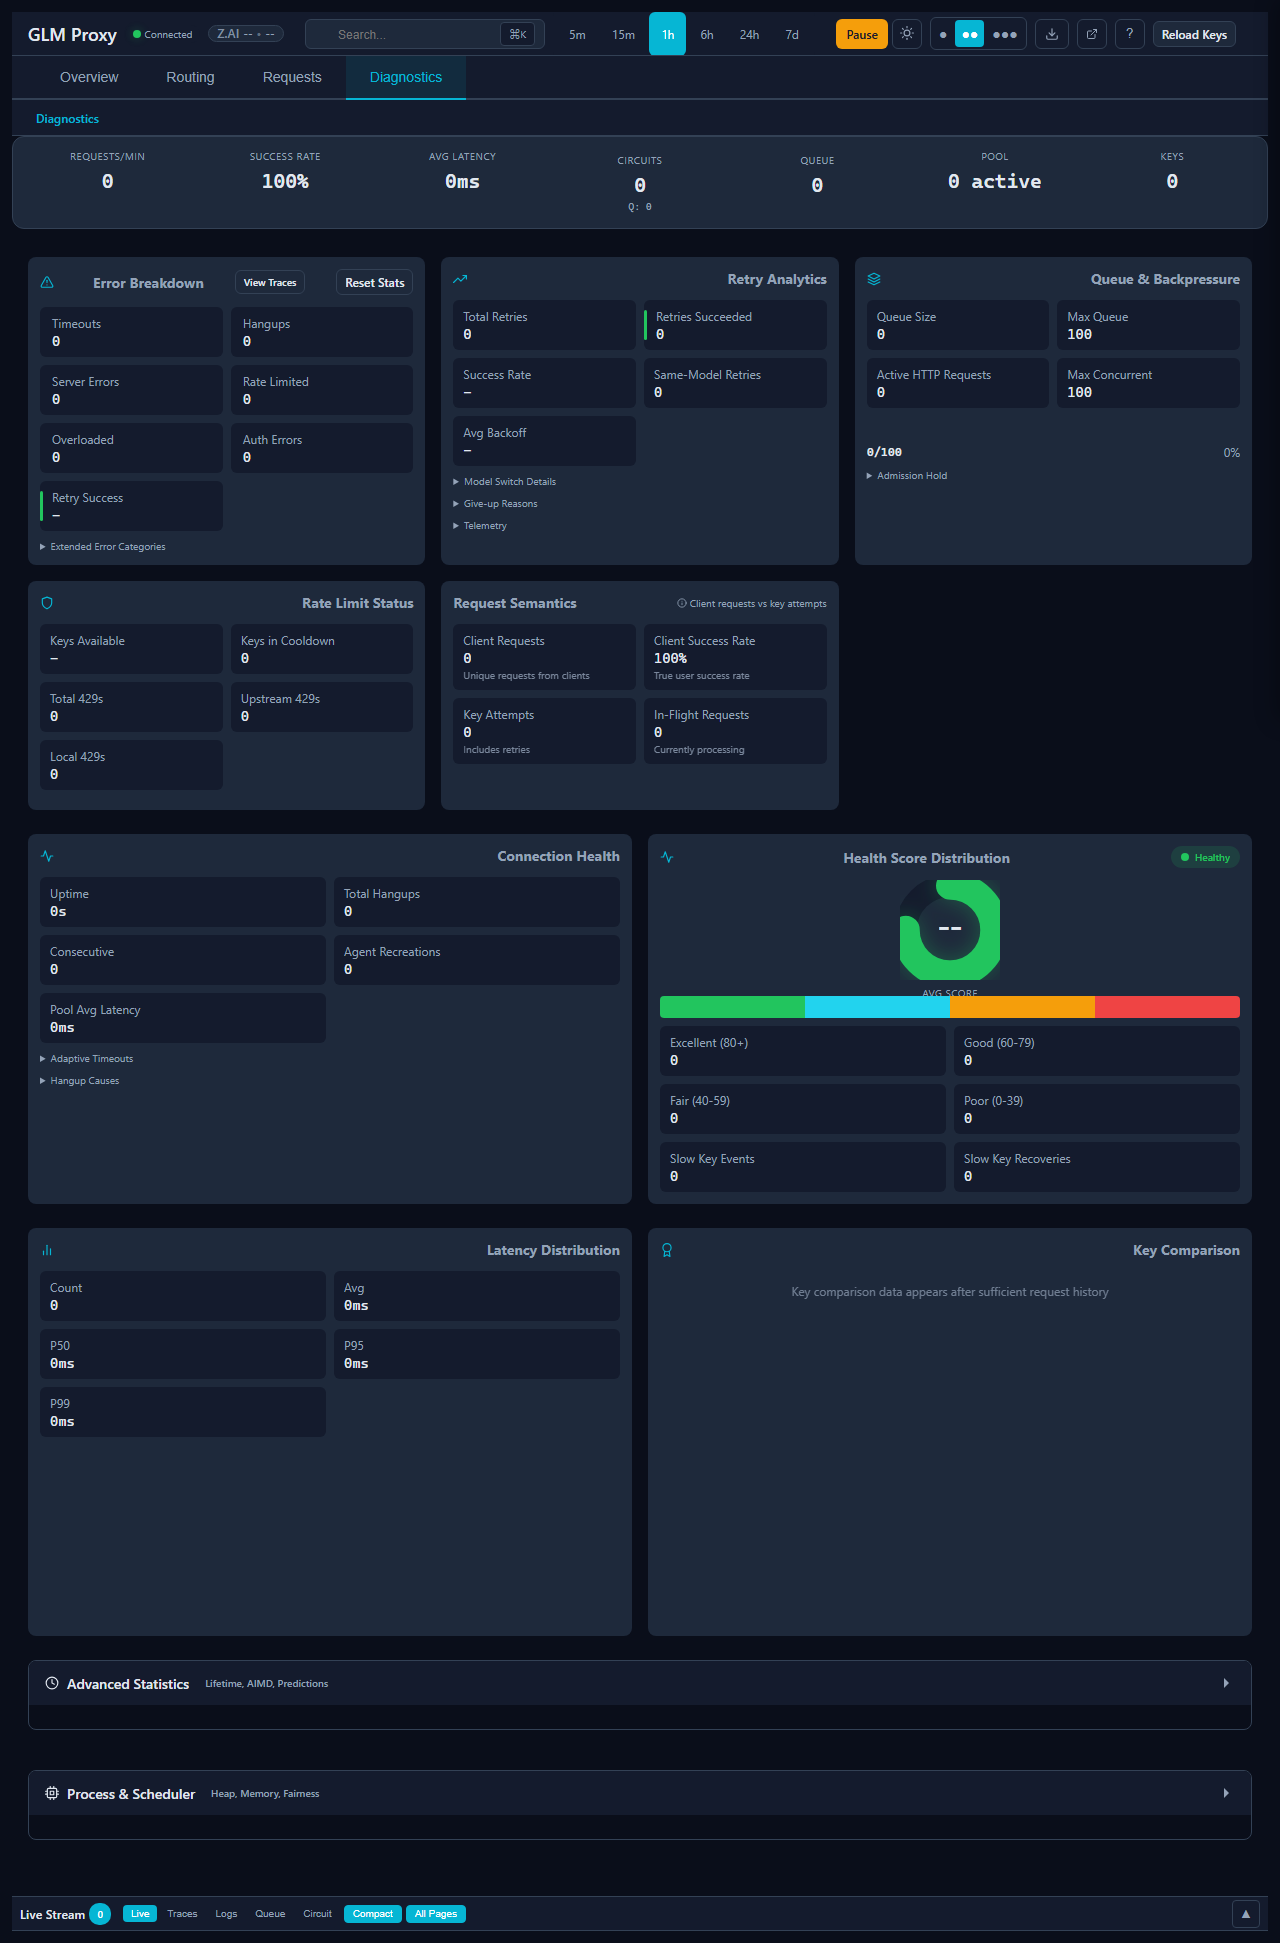
Key Metrics Visualizations
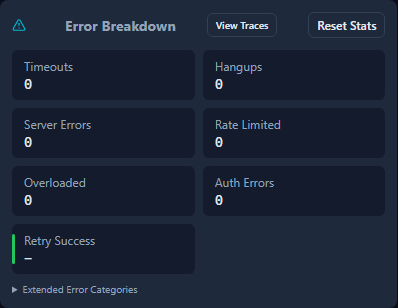
Error Breakdown - View error distribution including 429s and timeouts:
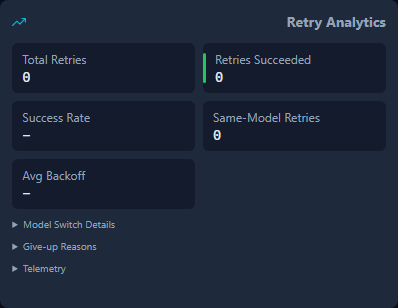
Retry Analytics - Monitor retry behavior and success rates:
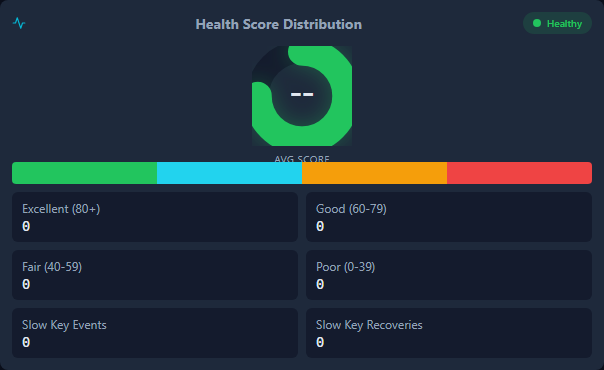
Health Score - Overall system health indicator:
Request Rate Chart - Throughput over time:

Latency Chart - Response time distribution:

Endpoints
| Endpoint | Format | Includes Month 1? |
|---|---|---|
GET /stats |
JSON | Yes (giveUpTracking, retryEfficiency, retryBackoff top-level keys) |
GET /metrics |
Prometheus exposition | Yes (all glm_proxy_* counters below) |
Metric Families
1. Give-Up Tracking
Fires when the retry loop stops early instead of exhausting all attempts.
| Prometheus Metric | Type | Description |
|---|---|---|
glm_proxy_give_up_total |
counter | Total early give-up events |
glm_proxy_give_up_by_reason_total{reason="max_429_attempts"} |
counter | Give-ups from hitting max consecutive 429 attempts |
glm_proxy_give_up_by_reason_total{reason="max_429_window"} |
counter | Give-ups from exceeding the 429 time window |
JSON /stats path: giveUpTracking.total, giveUpTracking.byReason.max_429_attempts, giveUpTracking.byReason.max_429_window
Recording sites: request-handler.js — two break paths inside the LLM 429 retry acceptance logic (one for attempt cap, one for window cap).
2. Retry Efficiency
Quantifies how well the pool and model router serve alternative models during retries.
| Prometheus Metric | Type | Description |
|---|---|---|
glm_proxy_same_model_retries_total |
counter | Retries where pool assigned the same model already tried (waste) |
glm_proxy_models_tried_on_failure_total |
counter | Cumulative count of distinct models tried across all failed requests |
glm_proxy_model_switches_on_failure_total |
counter | Cumulative model switches across all failed requests |
glm_proxy_failed_requests_with_model_stats_total |
counter | Failed requests that had model routing (denominator for averaging) |
JSON /stats path: retryEfficiency.sameModelRetries, retryEfficiency.totalModelsTriedOnFailure, retryEfficiency.totalModelSwitchesOnFailure, retryEfficiency.failedRequestsWithModelStats
Recording sites:
sameModelRetries: Inside 429 acceptance path only. AmodelWasAlreadyTriedflag is set in the model tracking block (beforeattemptedModels.add()), then checked inside the LLM 429 acceptance path (afterllm429Retries++). This ensures the counter fires only for 429-driven retries, not onresponseStartedbreaks, cap-reached breaks, or non-429 errors.failedRequestsWithModelStats: Fires exactly once per final failure, gated onattemptedModels.size > 0(excludes client disconnects that exit before any attempt completes).
3. Retry Backoff
Tracks time spent sleeping between retry attempts.
| Prometheus Metric | Type | Description |
|---|---|---|
glm_proxy_retry_backoff_ms_sum |
counter | Cumulative retry backoff delay in milliseconds |
glm_proxy_retry_backoff_count |
counter | Total retry backoff delay events |
JSON /stats path: retryBackoff.totalDelayMs, retryBackoff.delayCount
Important distinction: Only tracks attempt>0 retry backoff sleeps. Does NOT include pool-cooldown sleeps or proactive pacing sleeps. The denominator universe is retryBackoff.delayCount, not errors.totalRetries (since retries with zero delay don’t increment delayCount).
4. Tier Downgrade (Model Router)
Tracks when the model router downgrades a request to a lower tier (e.g., heavy -> medium) due to 429 pressure on the original tier’s models.
| Prometheus Metric | Type | Description |
|---|---|---|
glm_proxy_tier_downgrade_total |
counter | Active tier downgrade events (actually served from lower tier) |
glm_proxy_tier_downgrade_shadow_total |
counter | Shadow tier downgrade events (would-have-downgraded, logged only) |
glm_proxy_tier_downgrade_by_route_total{from="X",to="Y"} |
counter | Active downgrades by route (e.g., from="heavy",to="medium") |
glm_proxy_tier_downgrade_shadow_by_route_total{from="X",to="Y"} |
counter | Shadow downgrades by route |
JSON /stats path: Available via GET /model-routing → stats.tierDowngradeTotal, stats.tierDowngradeShadow, stats.tierDowngradeByRoute, stats.tierDowngradeShadowByRoute
Label cardinality: Bounded to max 3 routes (heavy->medium, heavy->light, medium->light). Route recording is guarded by VALID_TIER_LABELS = {light, medium, heavy} — unknown tier names are silently dropped from route labels.
Shadow mode: When allowTierDowngrade: false (default), downgrades are only recorded as shadow events. This lets you measure the impact before enabling active downgrades.
5. Existing Metrics (Fixed/Clarified)
| Prometheus Metric | Type | Note |
|---|---|---|
glm_proxy_retries_total |
counter | Deprecated. Tracks LLM 429 retries only. Use glm_proxy_retry_attempts_total for all-error retries. |
glm_proxy_retry_attempts_total |
counter | New. Total retry attempts across all error types (from errors.totalRetries). |
Grafana PromQL Examples
Give-Up Rate
Share of failed requests that were early give-ups:
rate(glm_proxy_give_up_total[5m])
  / rate(glm_proxy_requests_total{status="failed"}[5m])
Give-up breakdown by reason:
rate(glm_proxy_give_up_by_reason_total[5m])
Retry Waste Rate
Same-model retries as a share of LLM 429 retries (lower is better — means pool is offering alternatives):
rate(glm_proxy_same_model_retries_total[5m])
  / rate(glm_proxy_retries_total[5m])
A value near 0 means the pool consistently offers different models on retry. A value near 1 means single-model pools where every 429 retry hits the same model.
Average Models Tried Per Failure
How many distinct models were tried before giving up:
rate(glm_proxy_models_tried_on_failure_total[5m])
  / rate(glm_proxy_failed_requests_with_model_stats_total[5m])
Average Model Switches Per Failure
How many times the model changed during a failed request’s retry loop:
rate(glm_proxy_model_switches_on_failure_total[5m])
  / rate(glm_proxy_failed_requests_with_model_stats_total[5m])
Average Retry Backoff Delay
Mean time spent waiting between retry attempts:
rate(glm_proxy_retry_backoff_ms_sum[5m])
  / rate(glm_proxy_retry_backoff_count[5m])
Tier Downgrade Shadow Rate
How often the router would have downgraded if active downgrades were enabled:
rate(glm_proxy_tier_downgrade_shadow_total[5m])
Shadow downgrades by route (see which tier transitions are most common):
rate(glm_proxy_tier_downgrade_shadow_by_route_total[5m])
Active Downgrade Rate
When allowTierDowngrade: true:
rate(glm_proxy_tier_downgrade_total[5m])
429 Efficiency Dashboard Panel
Composite view of retry intelligence:
# Panel 1: Give-up rate (target: < 10% of failures)
rate(glm_proxy_give_up_total[5m]) / rate(glm_proxy_requests_total{status="failed"}[5m])

# Panel 2: Retry waste rate (target: < 20%)
rate(glm_proxy_same_model_retries_total[5m]) / rate(glm_proxy_retries_total[5m])

# Panel 3: Avg models tried (target: > 1.5 = pool diversity)
rate(glm_proxy_models_tried_on_failure_total[5m]) / rate(glm_proxy_failed_requests_with_model_stats_total[5m])

# Panel 4: Avg backoff delay (target: < 2000ms)
rate(glm_proxy_retry_backoff_ms_sum[5m]) / rate(glm_proxy_retry_backoff_count[5m])

# Panel 5: Shadow downgrades (informational — shows potential savings)
rate(glm_proxy_tier_downgrade_shadow_total[5m])
JSON /stats Example Output
{
  "giveUpTracking": {
    "total": 12,
    "byReason": {
      "max_429_attempts": 8,
      "max_429_window": 4
    }
  },
  "retryEfficiency": {
    "sameModelRetries": 3,
    "totalModelsTriedOnFailure": 45,
    "totalModelSwitchesOnFailure": 22,
    "failedRequestsWithModelStats": 15
  },
  "retryBackoff": {
    "totalDelayMs": 18500,
    "delayCount": 30
  }
}
Derived values (compute in dashboards, not server-side):
- Avg models tried per failure:
45 / 15 = 3.0 - Avg model switches per failure:
22 / 15 = 1.47 - Avg backoff delay:
18500 / 30 = 617ms
Implementation Notes
- All counters are raw monotonic values. Rates and averages are computed in Grafana, not in the proxy.
- Counters set
this.dirty = trueon mutation to trigger periodic disk persistence. - The
appendMonth1Metrics()function instats-controller.jsis the single source of truth for Prometheus formatting — shared between the modular controller and the monolithproxy-server.js. - Tier downgrade route labels are bounded by
VALID_TIER_LABELSguard to prevent cardinality explosion from unexpected configs. reset()on StatsAggregator zeroes all Month 1 counters. ModelRouter’sreset()zeroes tier downgrade counters.