Dashboard Guide
The AI Proxy includes a comprehensive real-time dashboard for monitoring requests, managing routing, and diagnosing issues.
Related:
- Monitoring Guide - API endpoints for health and stats
- Configuration Guide - Dashboard and proxy settings
- Events SSE Contract - Real-time event streaming
- Metrics Reference - Prometheus metrics
Accessing the Dashboard
Once the proxy is running, access the dashboard at:
http://127.0.0.1:18765/dashboard
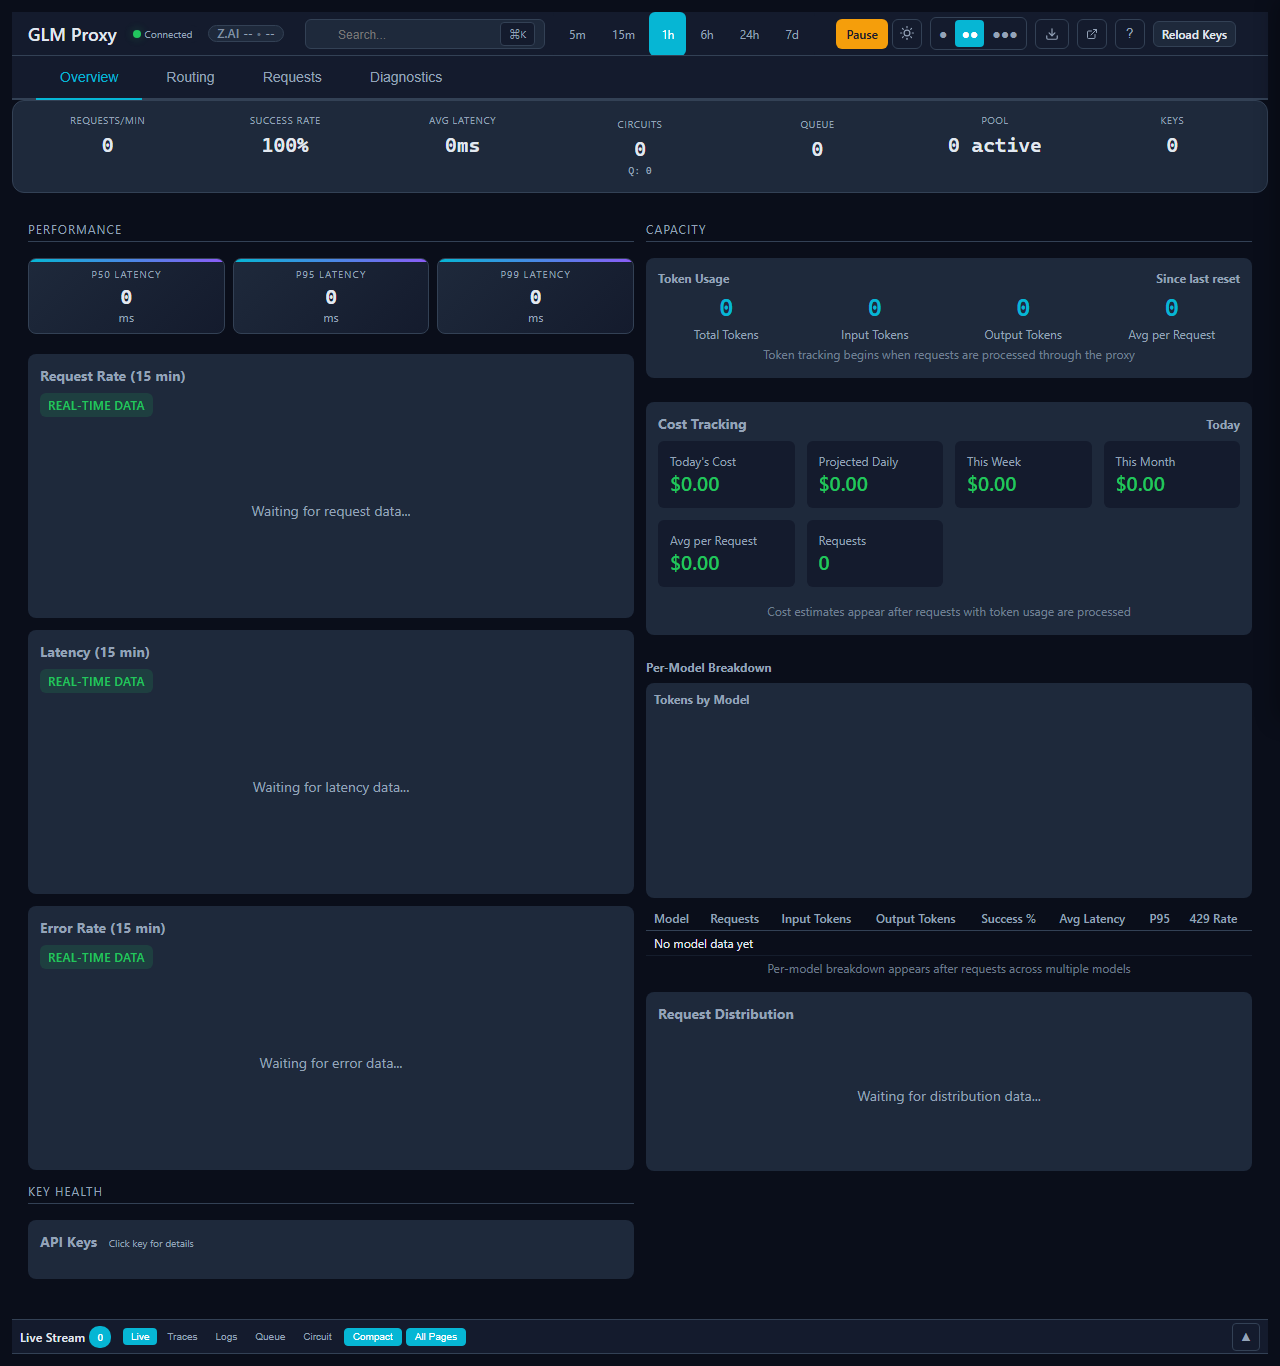
Dashboard Navigation
Page Navigation Tabs
Switch between main dashboard pages using the navigation tabs in the header:

| Tab | Description |
|---|---|
| Overview | Key metrics, charts, and live stream |
| Requests | Live traces, logs, queue, and circuit status |
| Routing | Model routing configuration and tier management |
| System | Diagnostics, error breakdown, and health score |
Connection Status
The header shows the live connection status to the upstream API:

- Green dot - Connected and receiving events
- Yellow dot - Connected but no recent events
- Red dot - Disconnected or connection error
Pause/Resume Control
Pause the proxy to stop accepting new requests (useful for maintenance):

When paused, all incoming requests return 503 Service Unavailable until resumed.
Dashboard Sections
Health Ribbon
The top ribbon shows key health metrics at a glance:
- Uptime - How long the proxy has been running
- Success Rate - Percentage of successful requests
- Requests/min - Current request rate
- Active Connections - Currently processing requests

Keys Heatmap
Visual representation of API key health and performance:

- Green cells - Healthy keys with high success rates
- Yellow cells - Keys with warnings or degraded performance
- Red cells - Failing or circuit-broken keys
- Color intensity - Indicates request volume (brighter = more requests)
- Pulsing border - Key has in-flight requests
Cost Panel
Track your API spending in real-time:
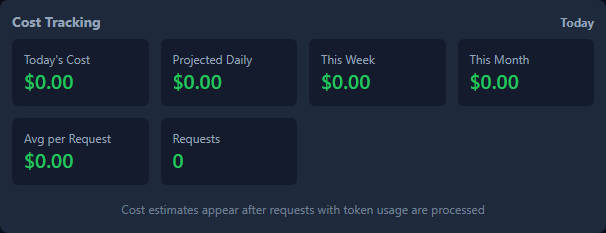
- Current session cost
- Projected daily/monthly costs
- Per-model cost breakdown
Request Charts
Real-time charts showing request patterns:


- Request Rate - Requests per minute over time
- Latency - Response time distribution (P50, P95, P99)
- Error Rate - Failed request percentage
Main Pages
Overview Page
The default landing page shows all key metrics and the live request stream.
Requests Page
Monitor live and historical requests:
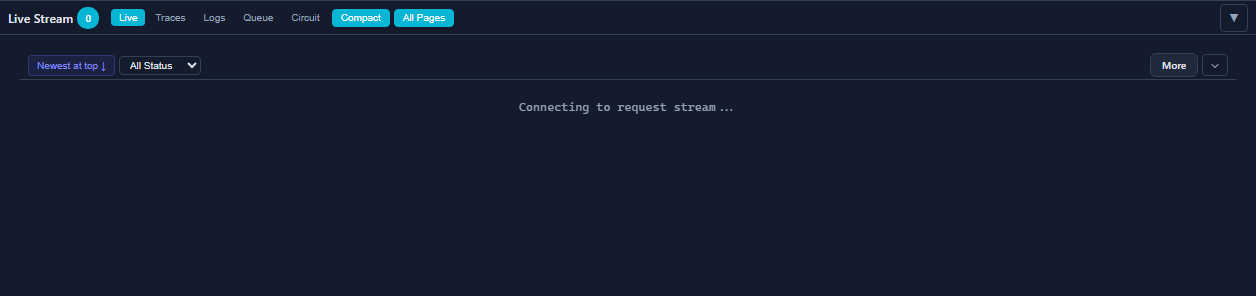
- Live Stream - Real-time incoming requests
- Traces - Detailed request traces
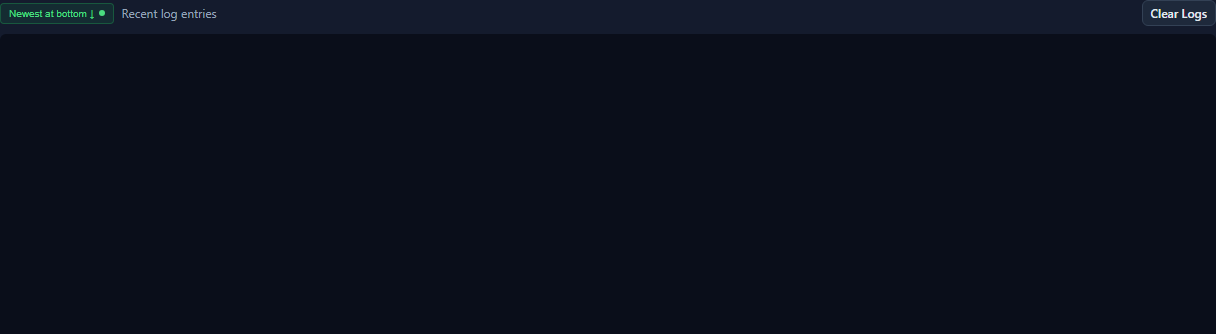
- Logs - Application logs
- Queue - Request queue status
- Circuit - Circuit breaker states
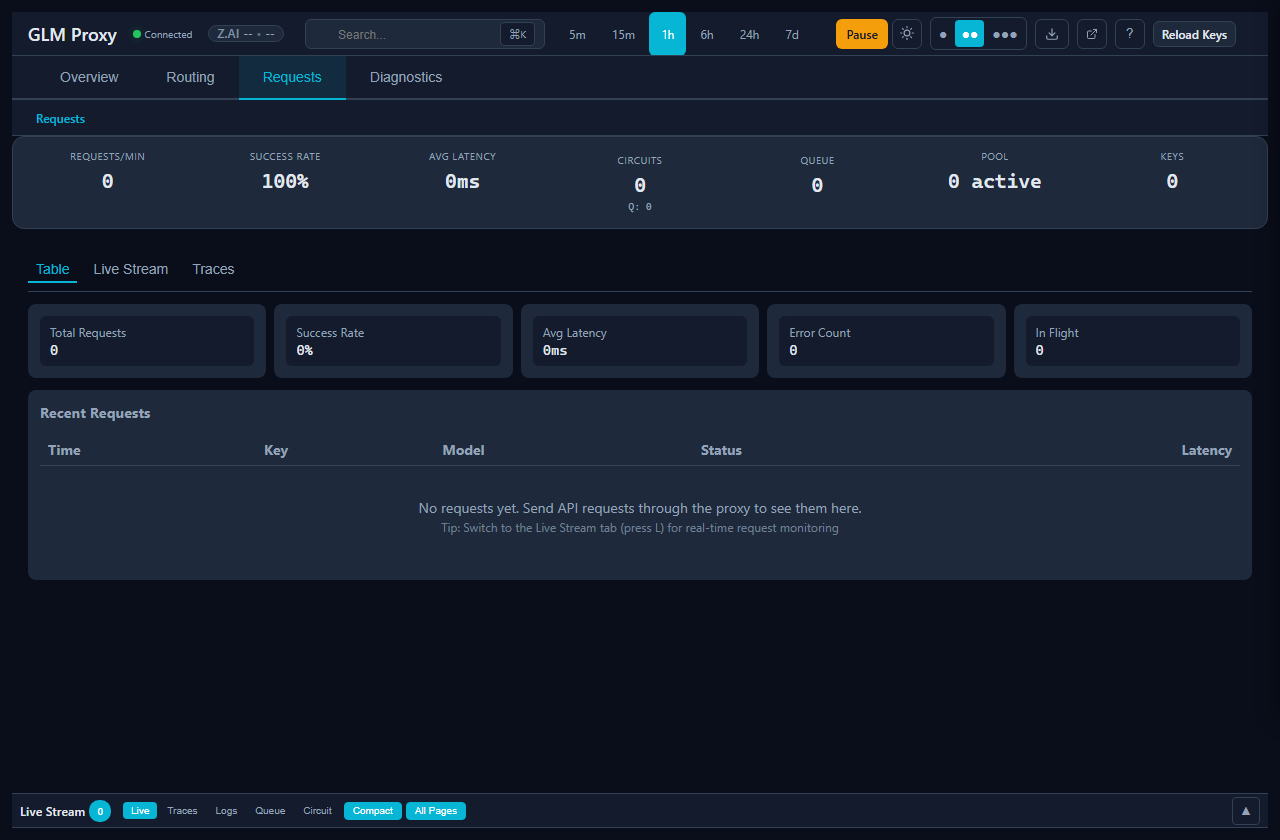
Traces Tab
View detailed request information including timing, model used, and retry attempts:

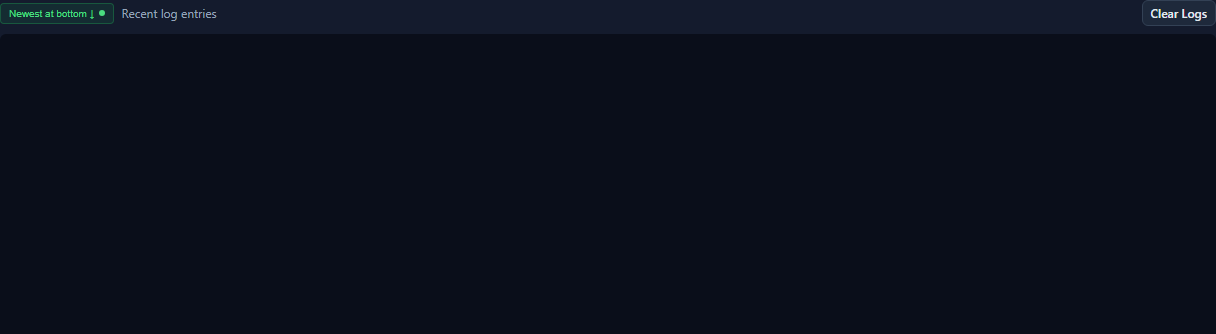
Logs Tab
Application-level logs for debugging:
Model Routing Page
Configure and monitor model routing:
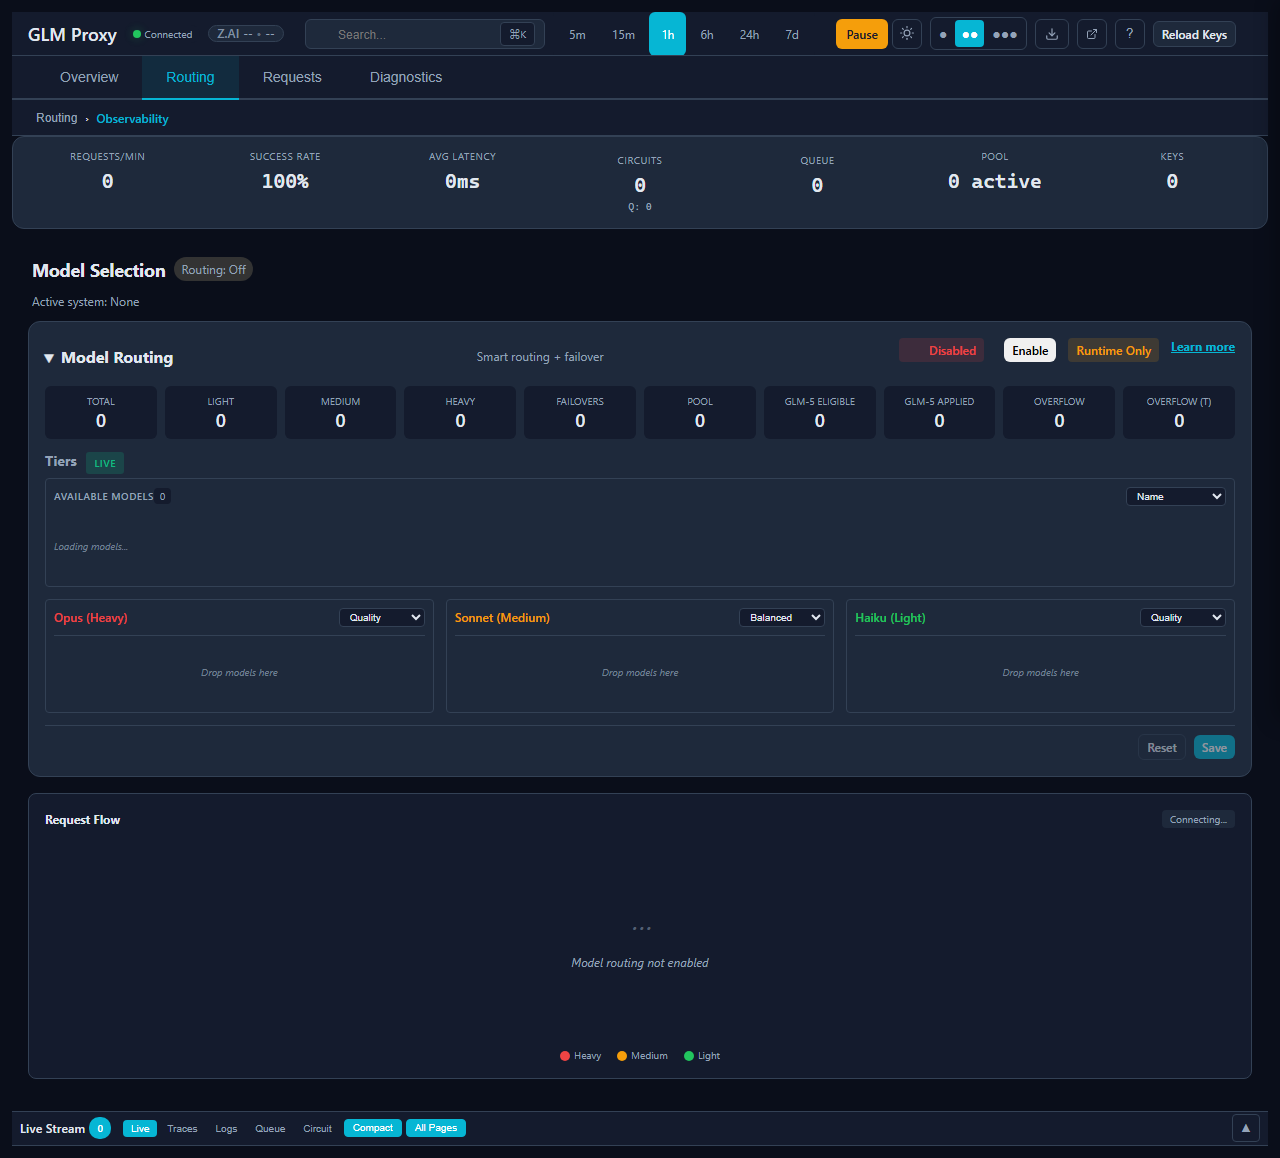
Model List
View all configured models with their pricing, tier assignments, and concurrency limits:
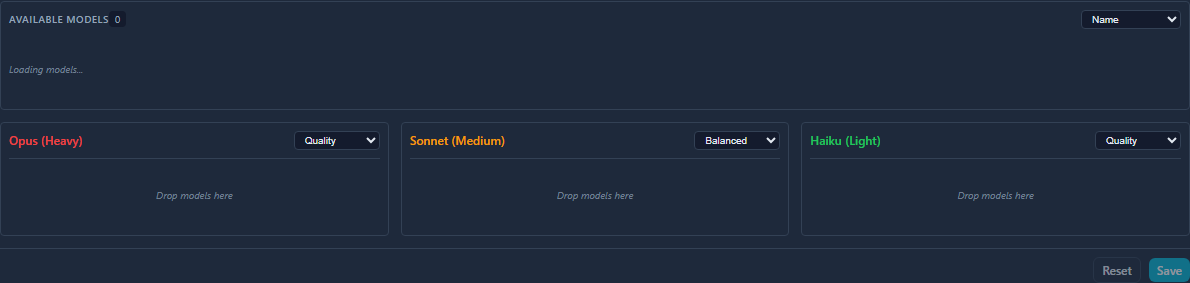
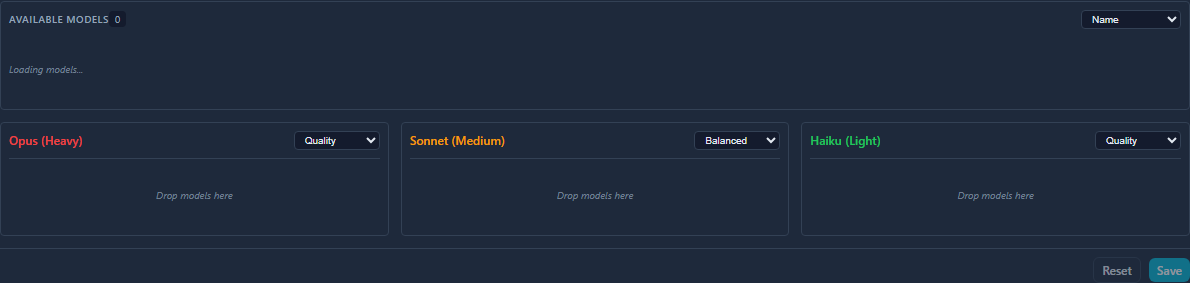
Tier Builder
Drag-and-drop interface for configuring routing tiers:
System Page
Diagnostics and advanced metrics:
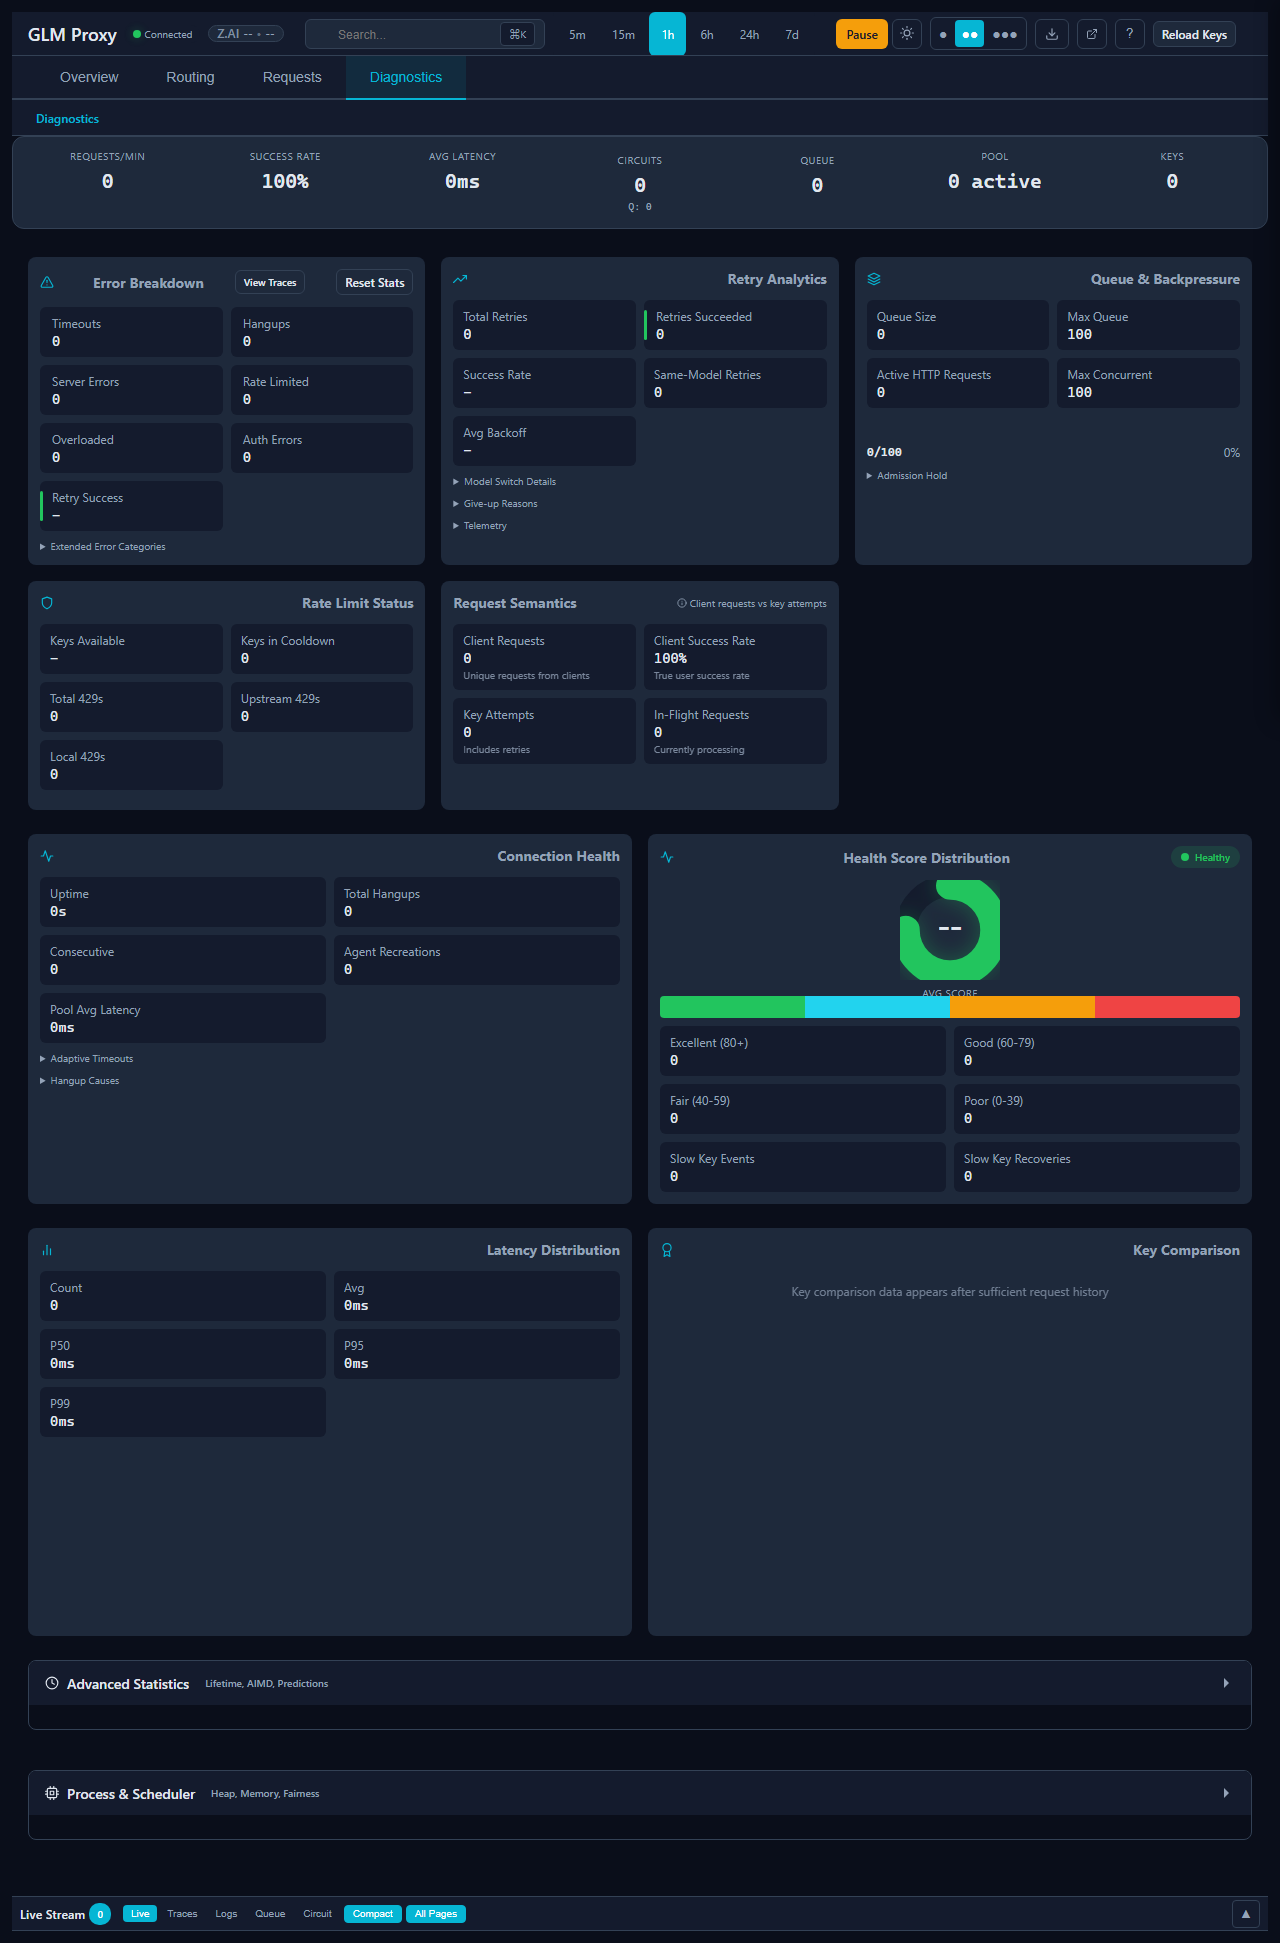
Circuit Breaker Indicators
View the current state of all circuit breakers:

- Green - Closed (normal operation)
- Yellow - Half-Open (testing recovery)
- Red - Open (circuit tripped, requests blocked)
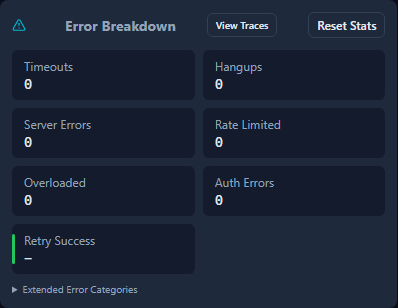
Error Breakdown
Categorized error analysis:
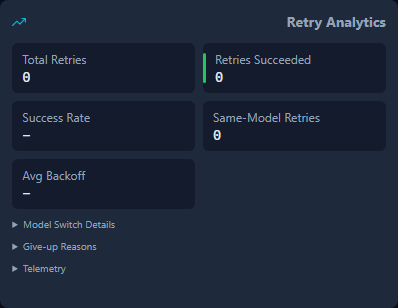
Retry Analytics
See how retries are performing:
Live Stream Panel
The bottom drawer contains the live request stream and related tabs:
Collapsed View
Expanded View

Dock Tabs
Switch between different views:
| Tab | Description |
|---|---|
| Live | Real-time request stream |
| Traces | Detailed request traces |
| Logs | Application logs |
| Queue | Request queue status |
| Circuit | Circuit breaker states |



Theme and Display Options
Themes
The dashboard supports both dark and light themes to match your preference and environment:

Dark Theme (default):
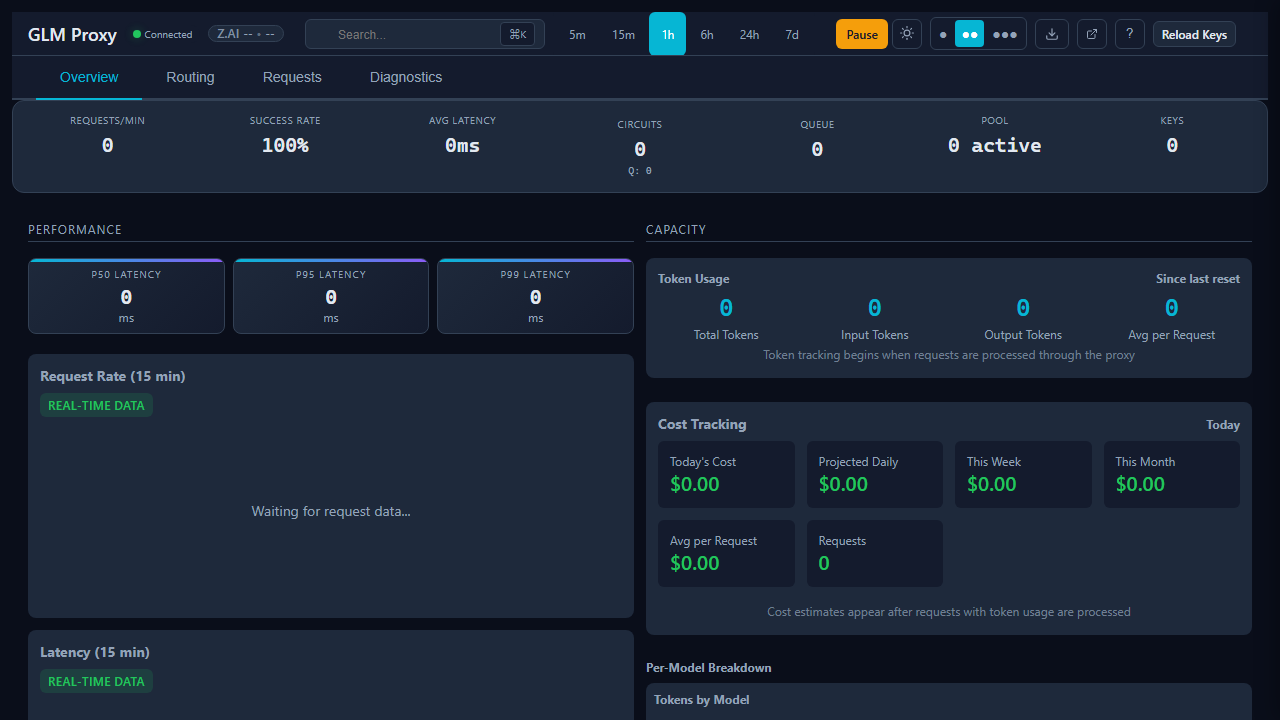
- Reduces eye strain in low-light environments
- Better for long coding sessions
- Lower power consumption on OLED displays
Light Theme:
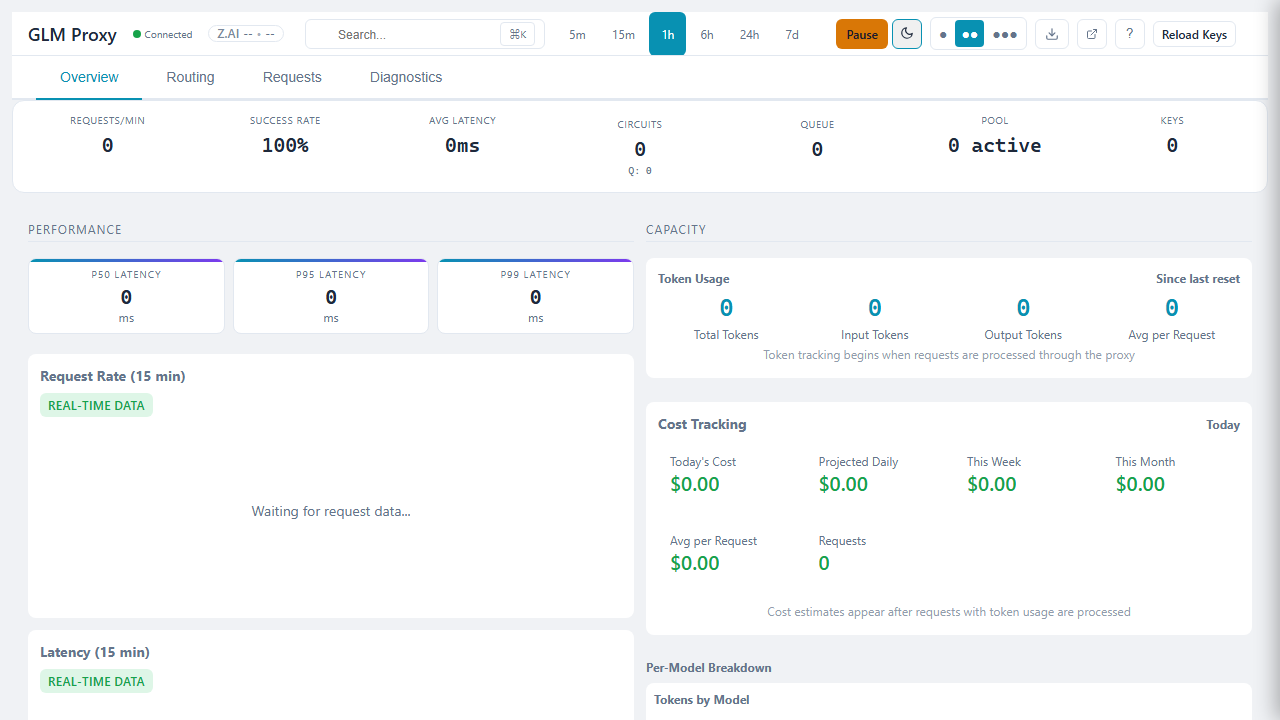
- Better visibility in bright environments
- Matches traditional light-mode applications
- Higher contrast for some users
How to Toggle:
- Click the theme toggle button (🌙/☀️) in the header
- Use keyboard shortcut: Press
T - Theme preference is saved in your browser
Density Modes
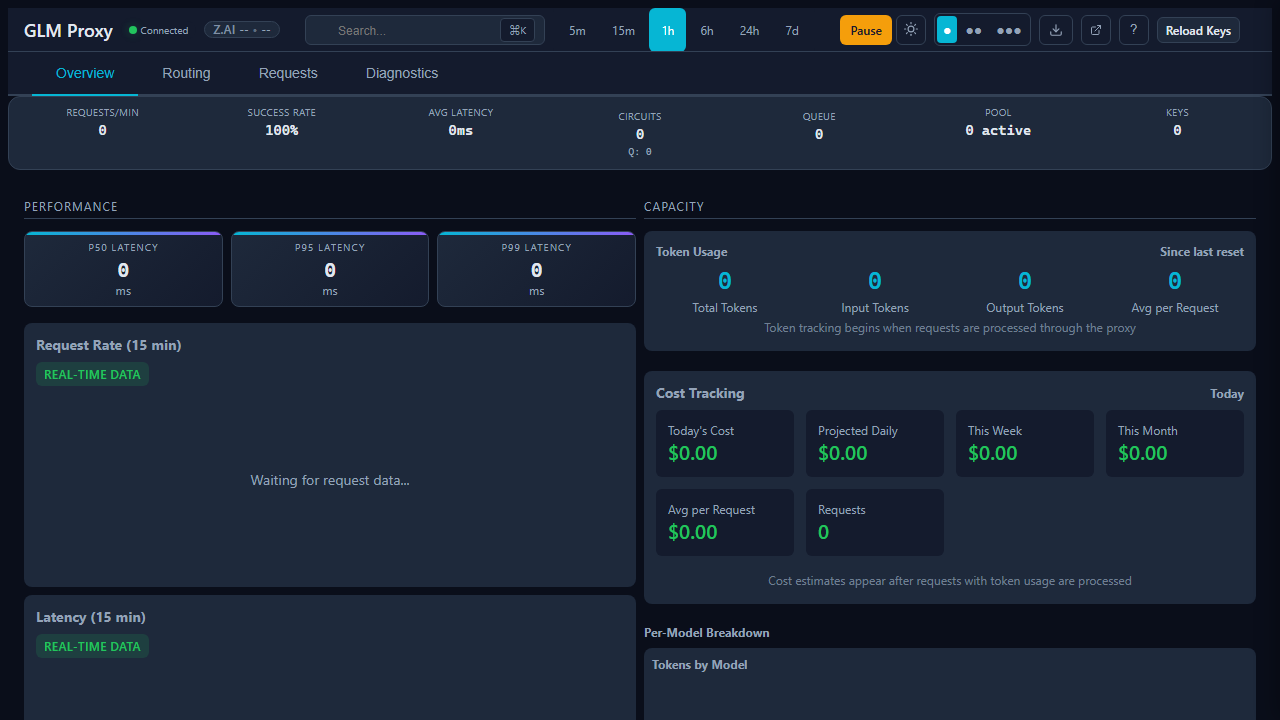
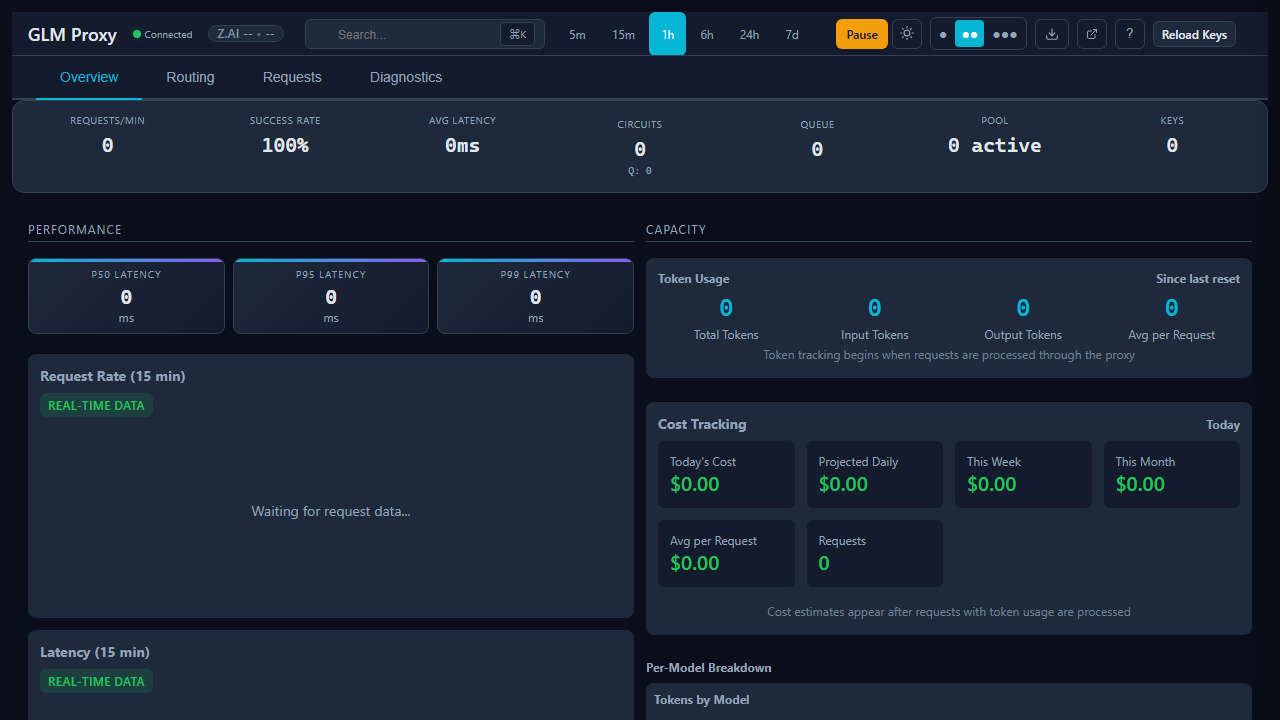
Adjust the layout density using the density selector:

- Compact - More information in less space
- Comfortable - Balanced spacing (default)
Time Range Selector
Change the time window for charts and statistics:

Options: 5m, 15m, 1h, 6h, 24h, 7d
Keyboard Shortcuts
Press ? to see all keyboard shortcuts:
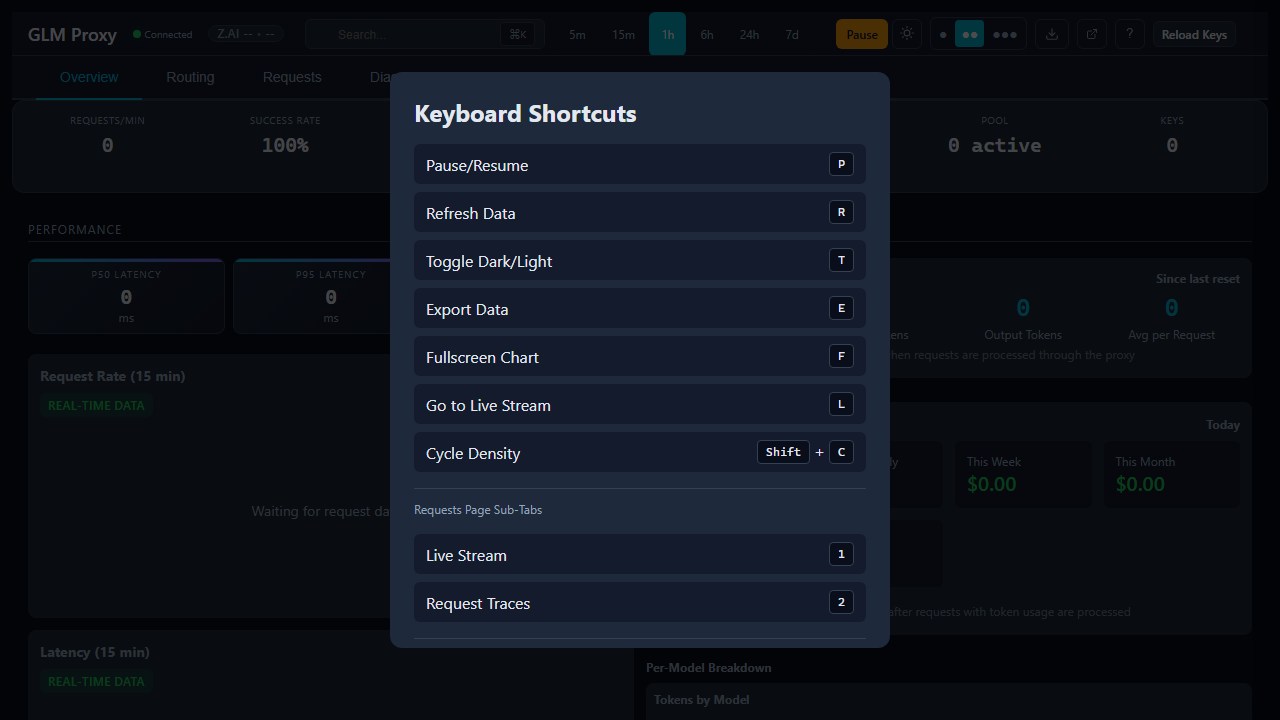
Essential Shortcuts
| Shortcut | Action |
|---|---|
? |
Show keyboard shortcuts |
P |
Pause/resume proxy |
R |
Switch to Requests page |
T |
Toggle theme |
E |
Toggle density |
L |
Toggle live stream panel |
F |
Toggle focus mode |
Ctrl+K |
Open search |
g + o |
Go to Overview |
g + r |
Go to Routing |
g + s |
Go to System |
1-5 |
Switch dock tabs |
Esc |
Close modals/drawers |
Progressive Disclosure
Advanced sections are collapsed by default to reduce visual clutter:
Advanced Statistics
Lifetime stats, AIMD concurrency, and predictions:


Process & Scheduler
System health and scheduler metrics:


Responsive Design
The dashboard is fully responsive and adapts to different screen sizes:
Mobile (375px)

Mobile-specific behavior:
- Navigation collapses into a hamburger menu
- Charts resize to fit narrow screens
- Live stream panel becomes full-width when expanded
- Keyboard shortcuts adapted for touch screens
Tablet (768px)
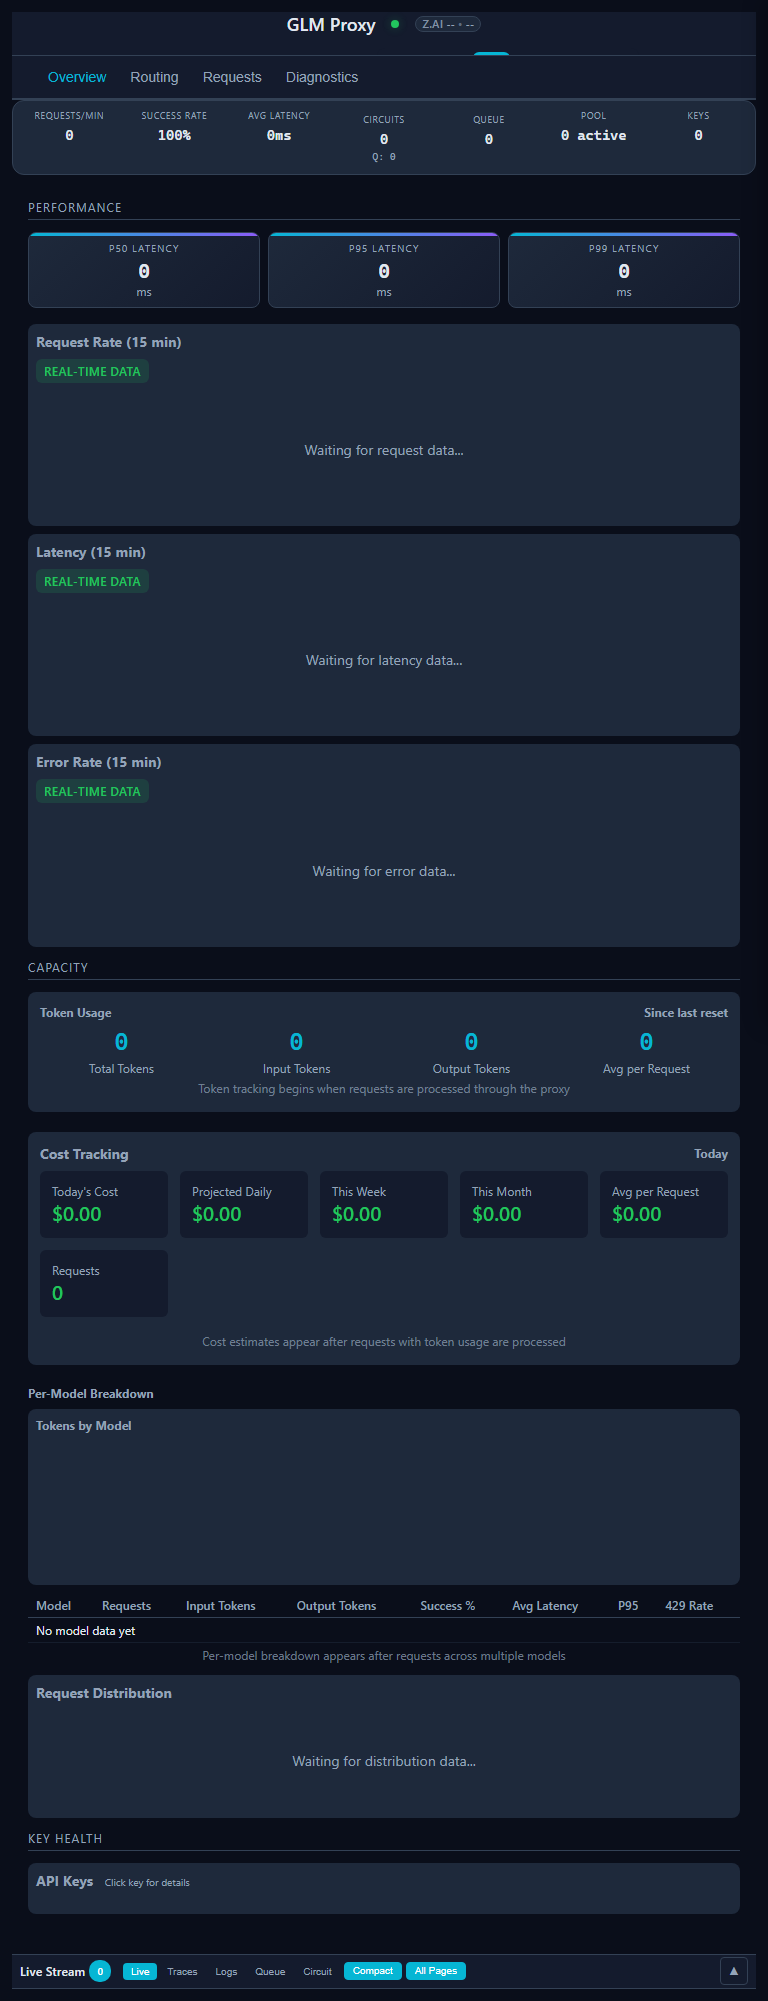
Tablet behavior:
- Side-by-side layout for some panels
- Touch-friendly button sizes
- Optimized chart dimensions
Desktop (1920px)
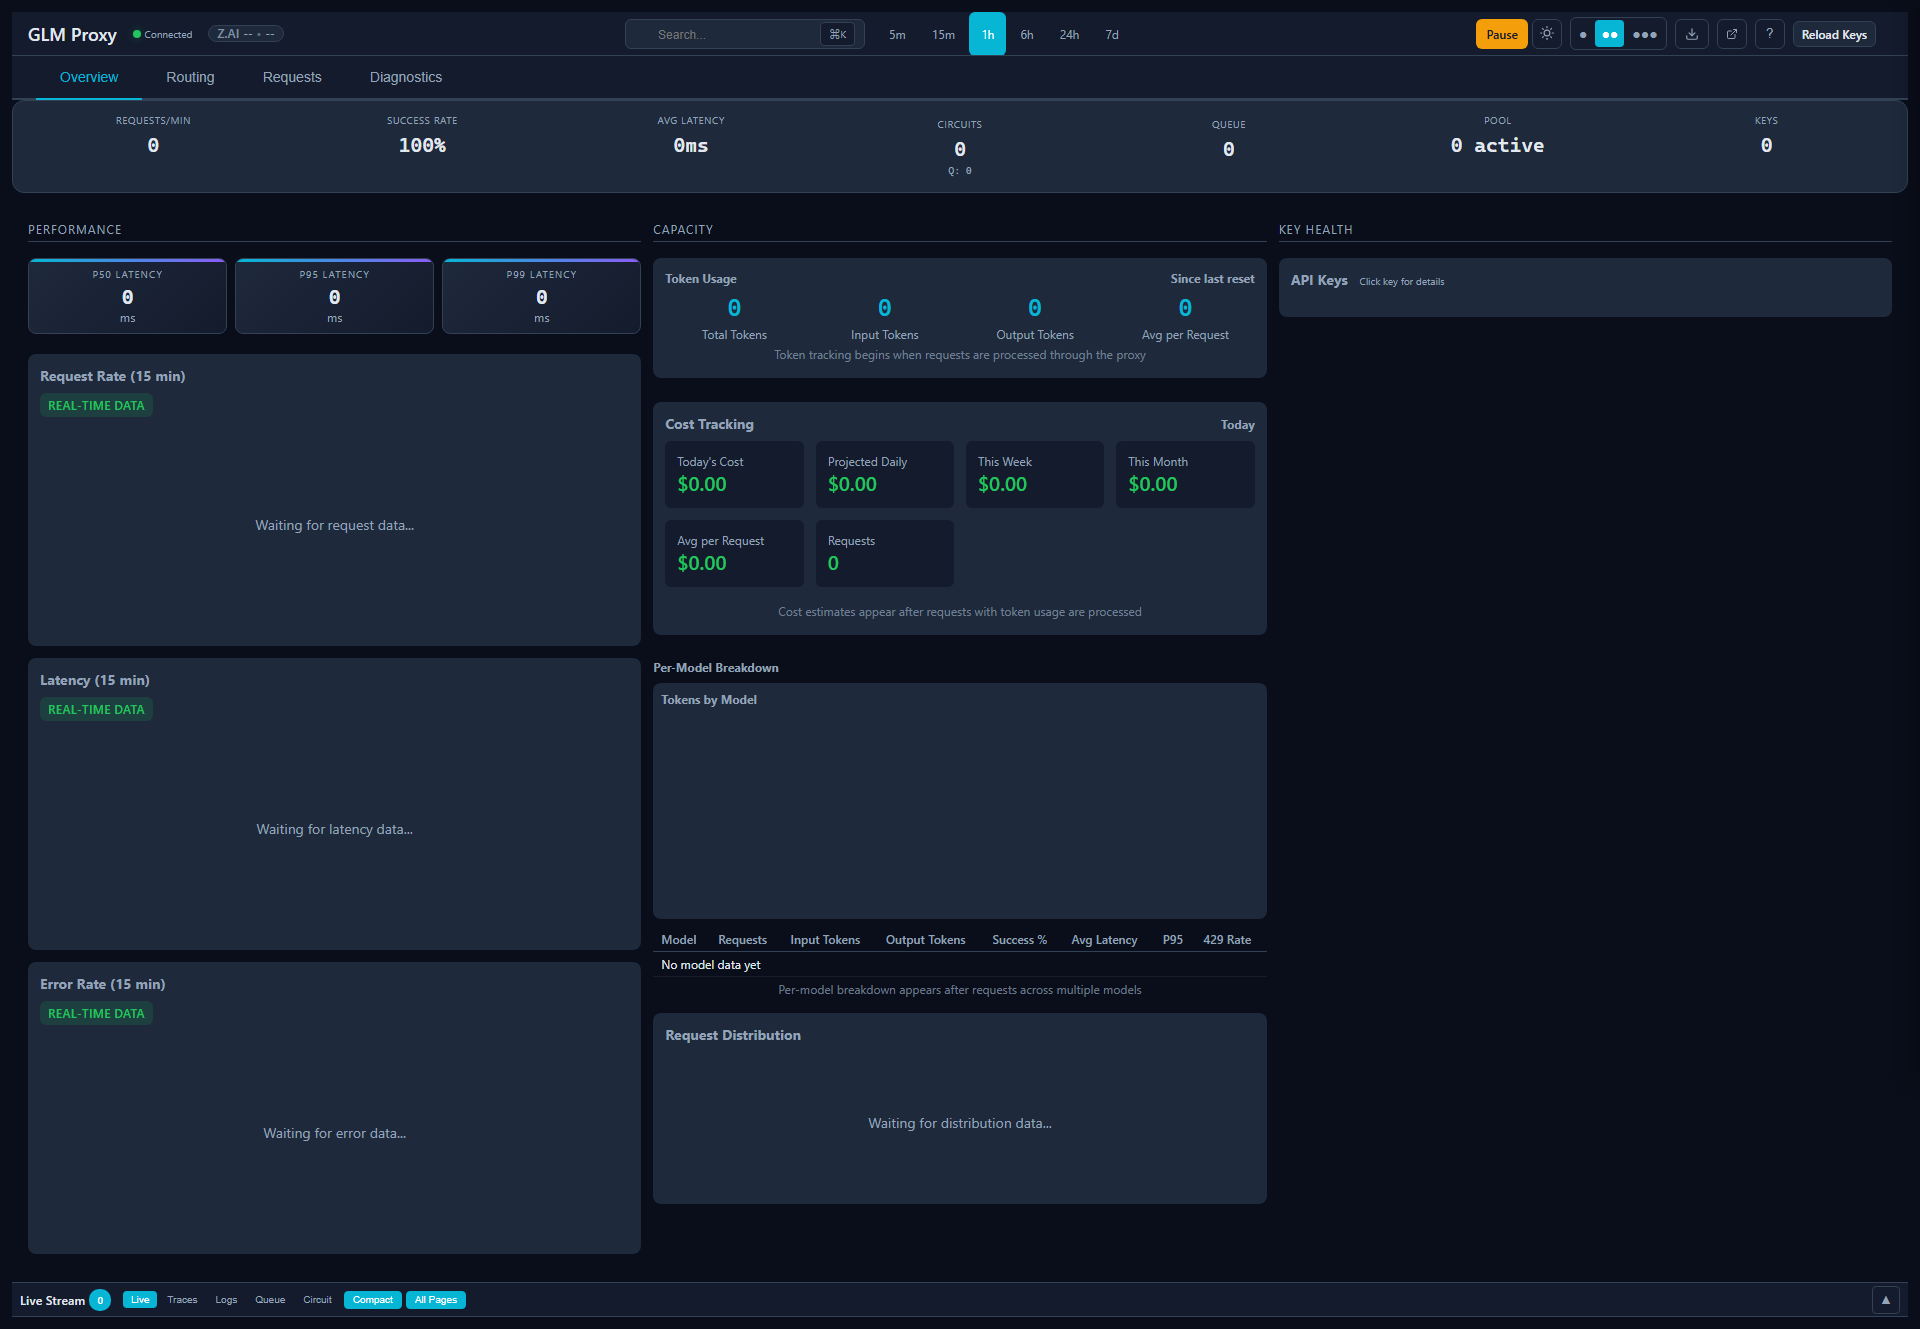
Desktop features:
- Full multi-column layout
- Wider charts with more data points
- Side-by-side panels and widgets
- Maximum information density
Navigation
The dashboard supports URL-based navigation for bookmarking and sharing:
/dashboard- Overview page (default)/dashboard#requests- Requests page/dashboard#routing- Model Routing page/dashboard#system- System page
Sub-pages are also supported:
/dashboard#requests/live- Live stream tab/dashboard#requests/traces- Traces tab/dashboard#requests/logs- Logs tab/dashboard#requests/queue- Queue tab/dashboard#requests/circuit- Circuit tab
Dashboard Glossary
Common terms used in the dashboard:
| Term | Definition |
|---|---|
| Circuit Breaker | Safety mechanism that temporarily disables failing API keys |
| CLOSED | Circuit breaker state indicating healthy operation |
| OPEN | Circuit breaker state indicating the key is disabled due to failures |
| HALF_OPEN | Circuit breaker testing if a previously failed key has recovered |
| In-Flight | Requests currently being processed (not yet completed) |
| P50/P95/P99 | Latency percentiles (50%, 95%, 99% of requests are faster than this) |
| RPM | Requests Per Minute - throughput metric |
| Tier | Model classification (Light/Medium/Heavy) based on capability and cost |
| Upstream | The target API service (e.g., Z.ai) that the proxy forwards requests to |
| Downstream | Your application making requests through the proxy |
| SSE | Server-Sent Events - real-time push from server to dashboard |
| Backpressure | System load indicator showing how many requests are queued/processing |
| Keys Heatmap | Visual grid showing health status of all API keys |
| Trace | Detailed record of a single request’s lifecycle |
| Health Score | Composite metric indicating overall system health (0-100) |
| AIMD | Additive Increase/Multiplicative Decrease - adaptive concurrency algorithm |
Dashboard States
Normal Operation
When everything is working correctly:
- All key cells show green in the heatmap
- Success rate is above 95%
- Connection status shows green dot
- No circuit breakers are OPEN
Error States
Connection Issues:
When the proxy cannot connect to the upstream API:
- Connection status shows red dot
- Keys may transition to OPEN state
- Error count increases in the system page
Rate Limited (429):
When API rate limits are hit:
- Keys show yellow/warning in heatmap
- Retry count increases
- Queue may fill up with waiting requests
All Keys Unhealthy:
When all API keys are failing:
- All keys show red in heatmap
- Dashboard displays warning banner
- Requests return 503 Service Unavailable
Interpreting the Health Score
The system page shows an overall health score (0-100):
| Score Range | Status | Action |
|---|---|---|
| 90-100 | Excellent | No action needed |
| 70-89 | Good | Monitor for trends |
| 50-69 | Degraded | Check error breakdown |
| 0-49 | Critical | Immediate attention required |
Troubleshooting with the Dashboard
See Also: Troubleshooting Guide for detailed problem solving.
Common diagnostic steps:
- Check Keys Heatmap - Identify which keys are unhealthy
- View Error Breakdown - Understand what types of errors are occurring
- Check Retry Analytics - See if retries are succeeding
- Review Logs Tab - Get detailed error messages
- Check Queue Status - See if requests are backing up
Next Steps
More Guides:
- Configuration - Customize proxy settings
- Monitoring - API endpoints for monitoring
- Model Routing - Detailed routing configuration
- Troubleshooting - Common issues and solutions