Dashboard Screenshots
This directory contains screenshots generated from E2E tests for documentation purposes.
Related:
- Dashboard Guide - Complete dashboard walkthrough
- Testing Guide - E2E test and screenshot generation
- Search Functionality - Documentation search index
Usage
Include screenshots in markdown using:

Regenerate Screenshots
Testing: See Testing Guide for full E2E test commands.
npm run screenshots:generate
npm run screenshots:extract
Categories
Main Views
| Screenshot | Description |
|---|---|
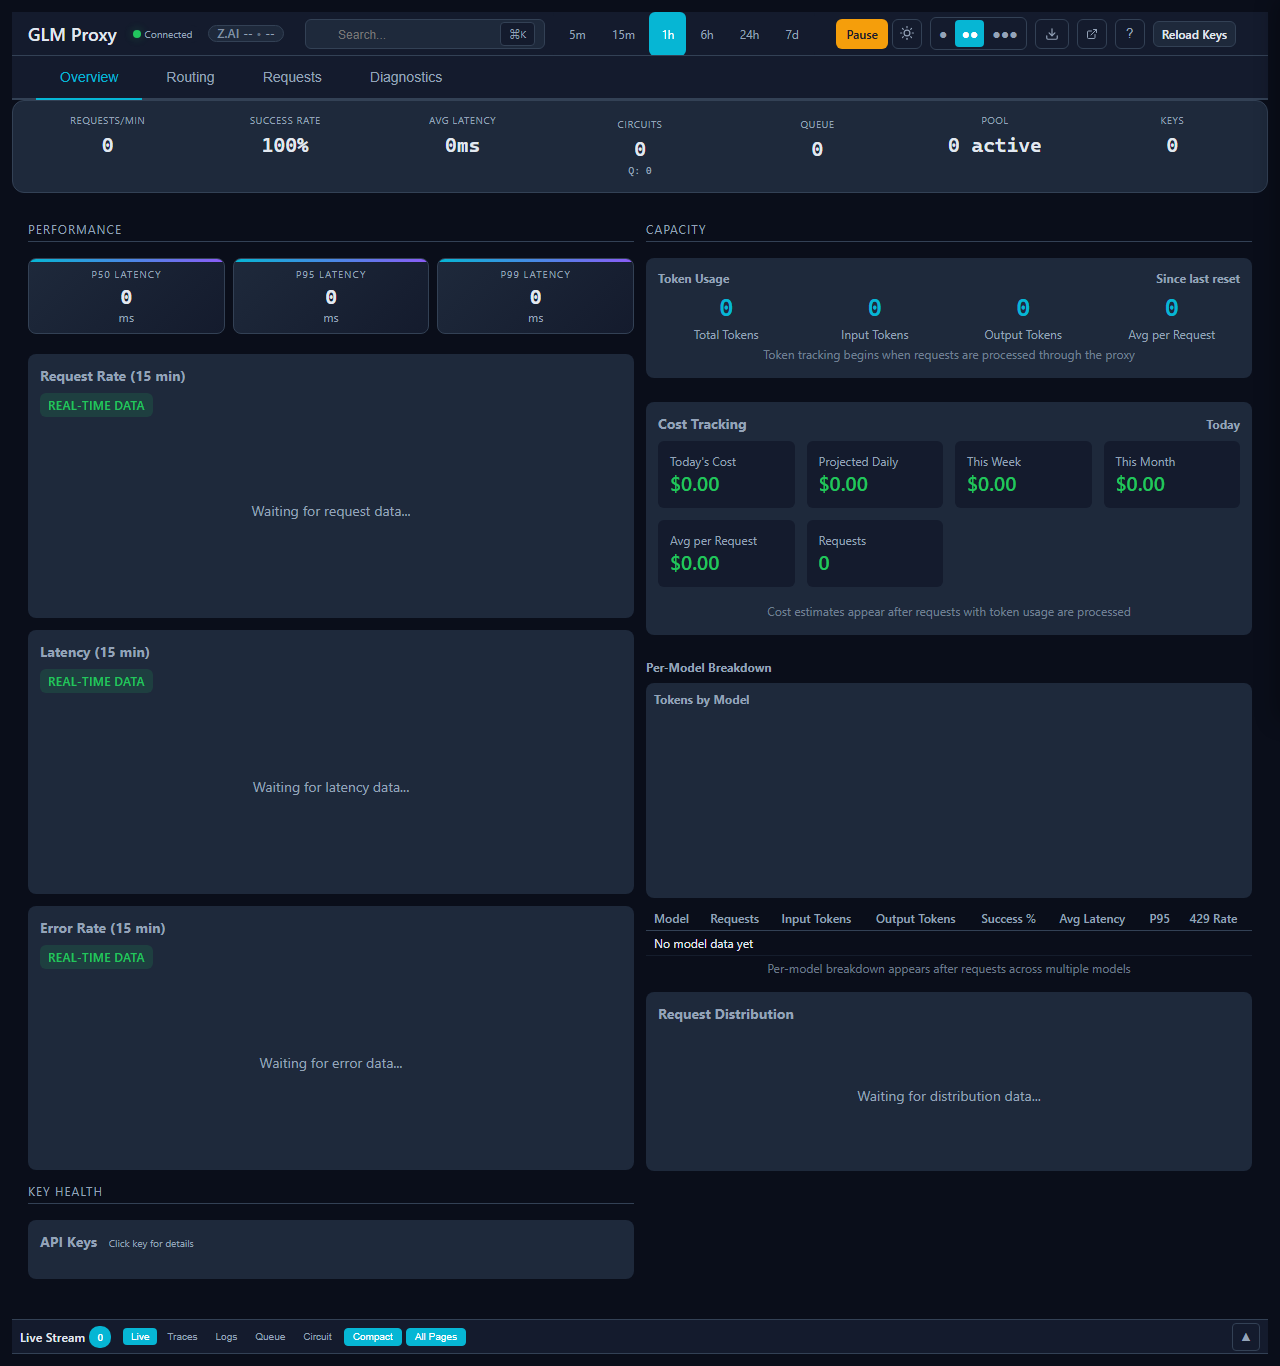
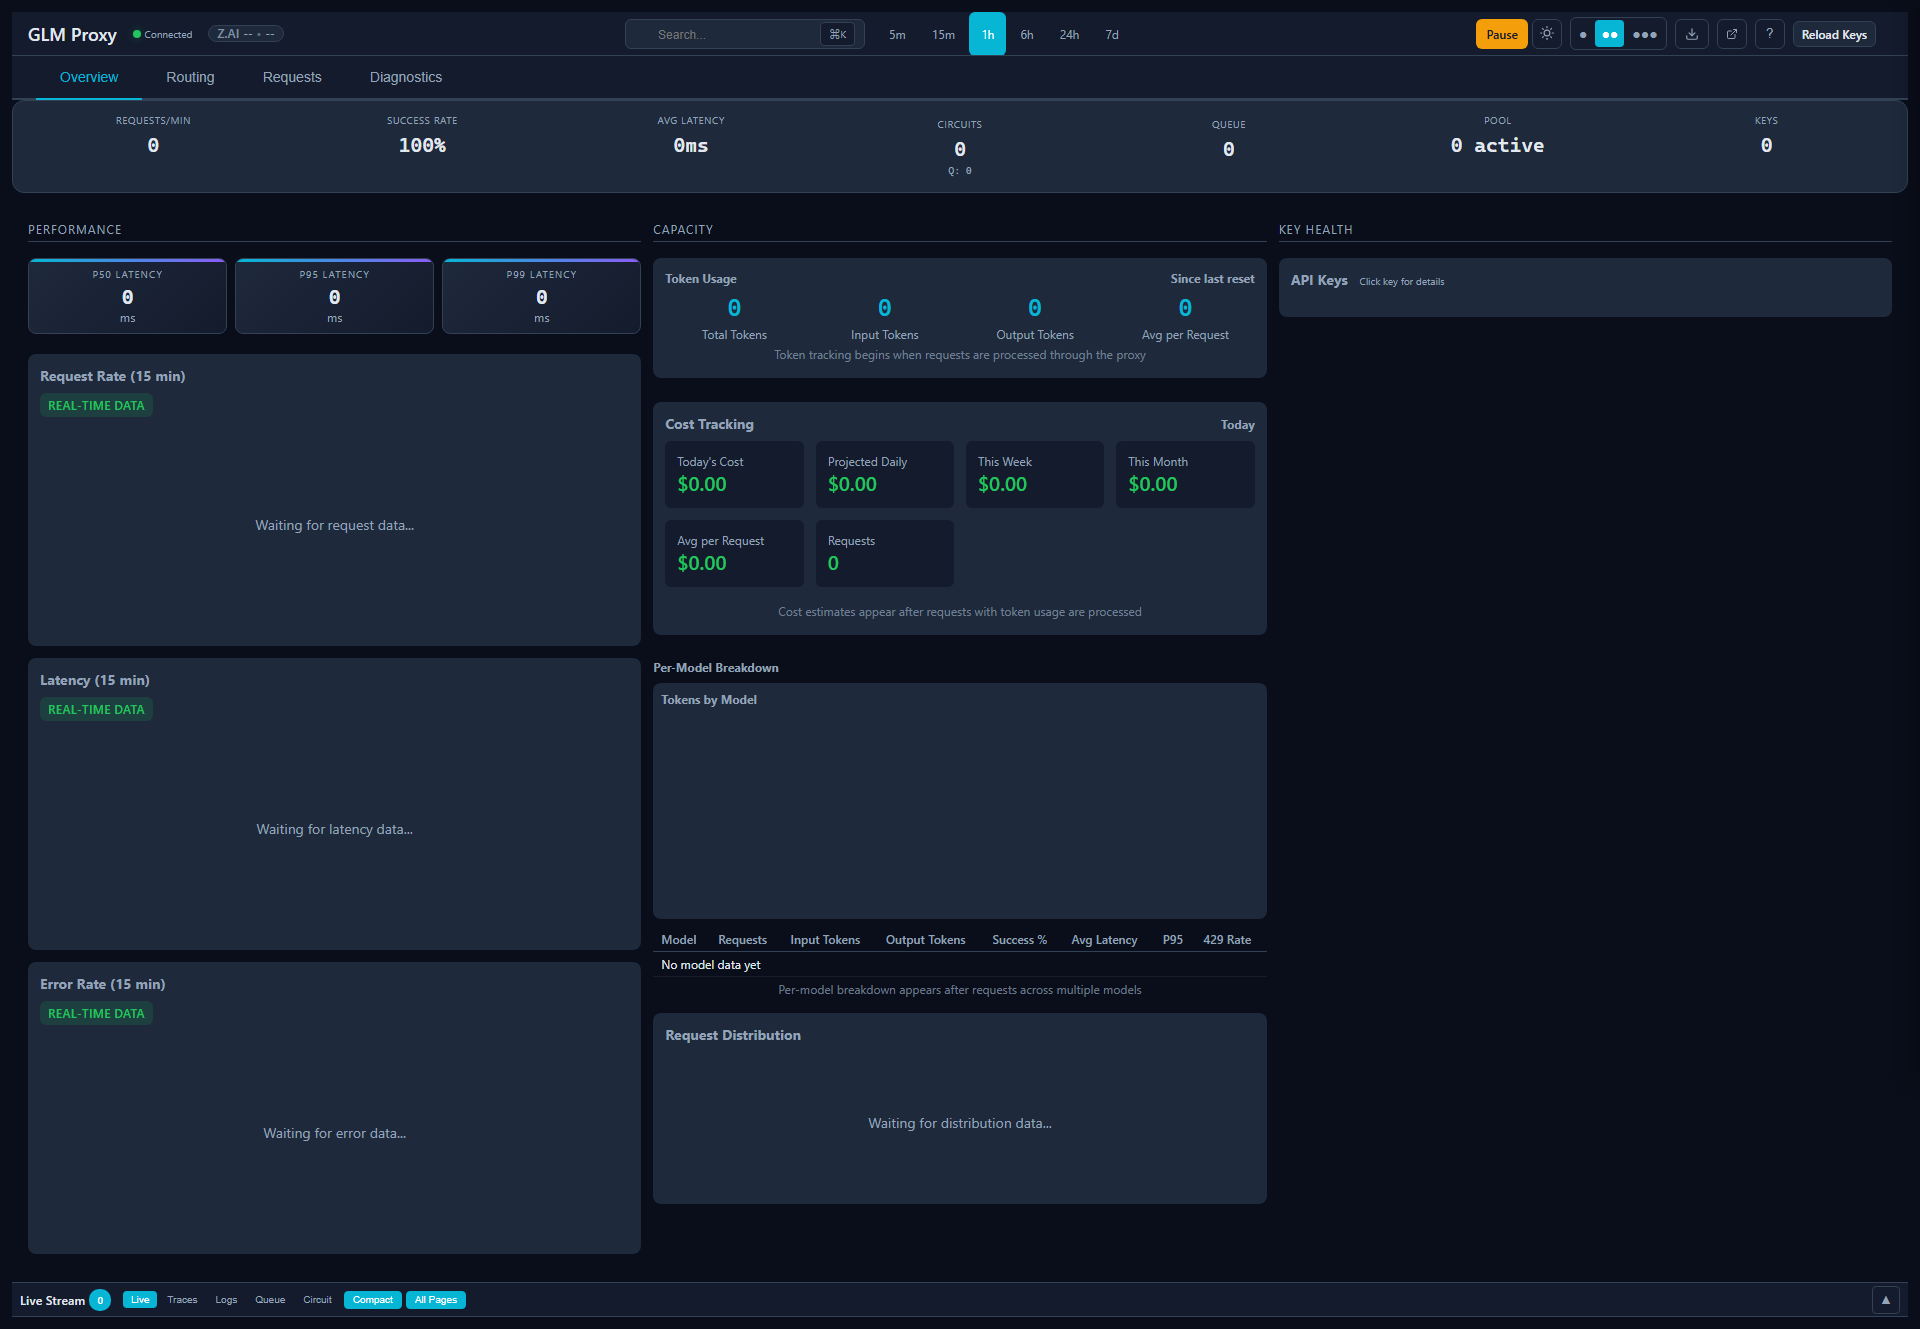
| overview | Dashboard overview page with all key metrics |
| routing | Model routing configuration page |
| requests | Requests monitoring page |
| system | System diagnostics and analytics page |
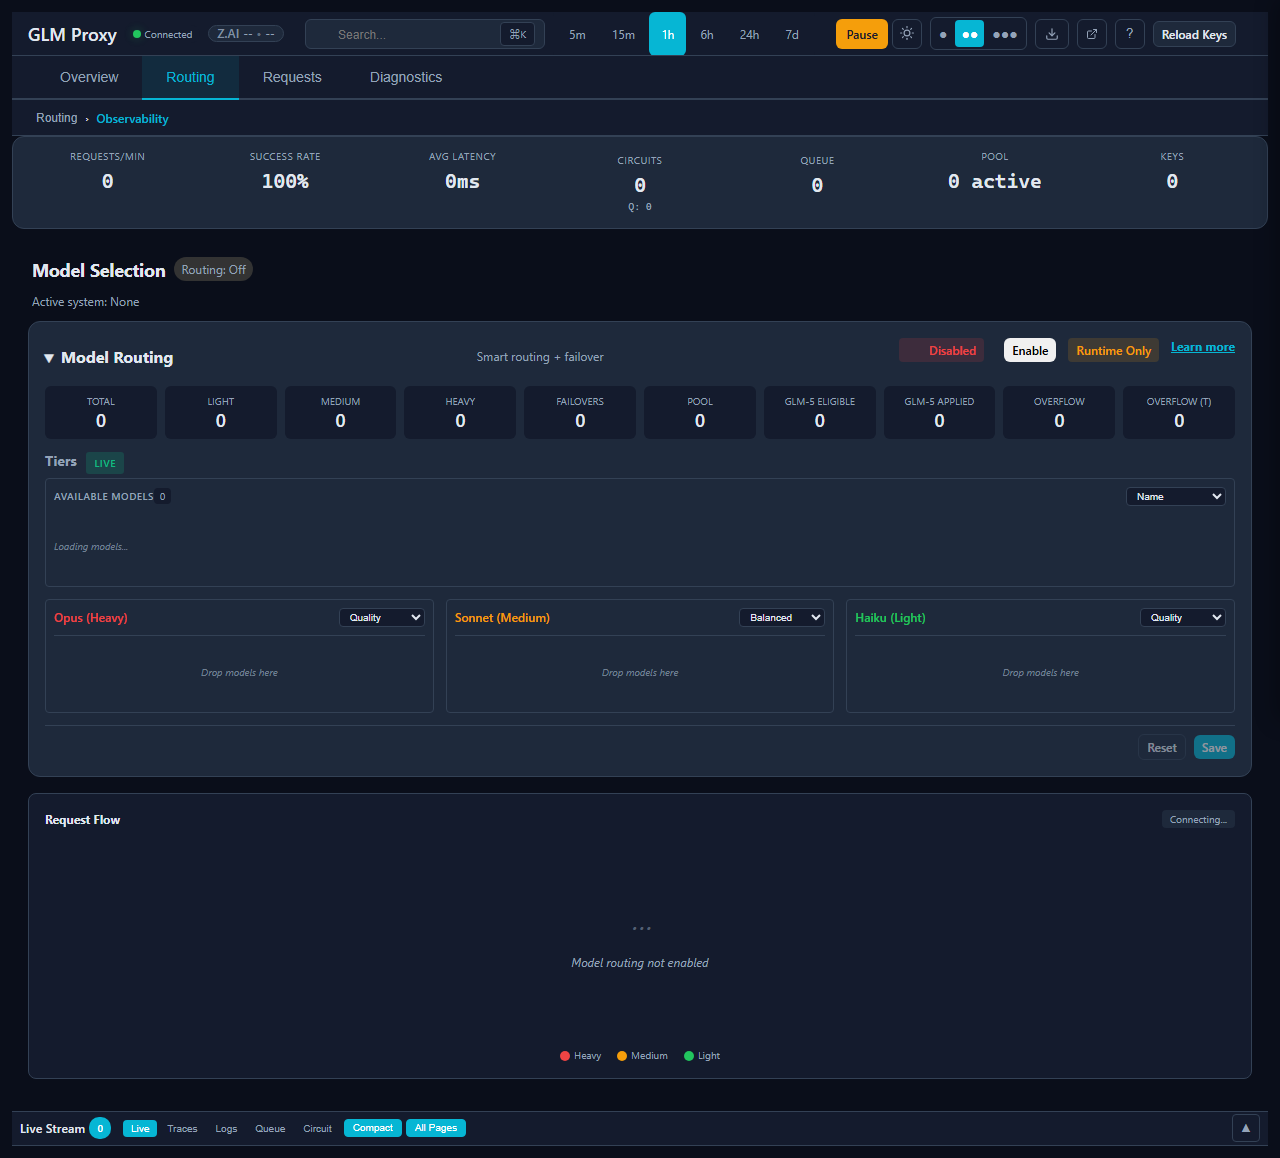
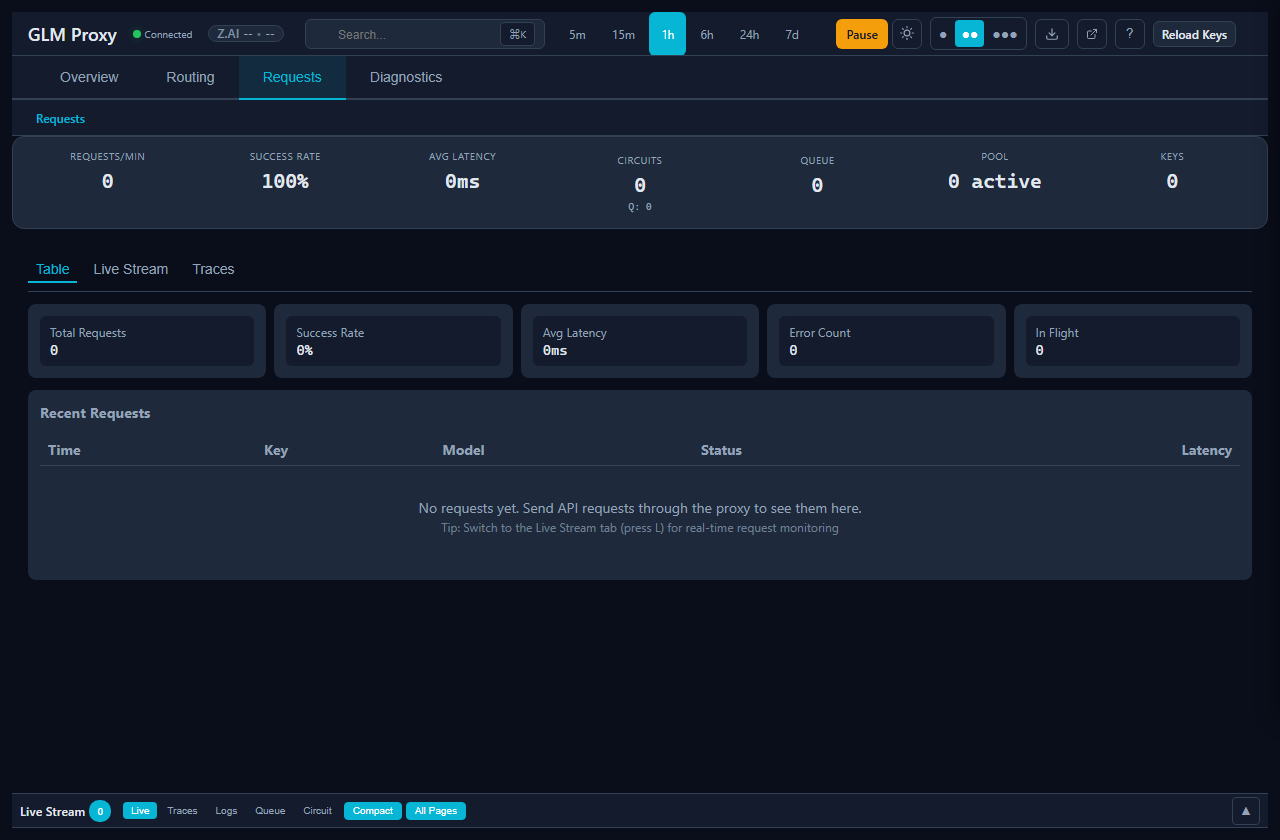
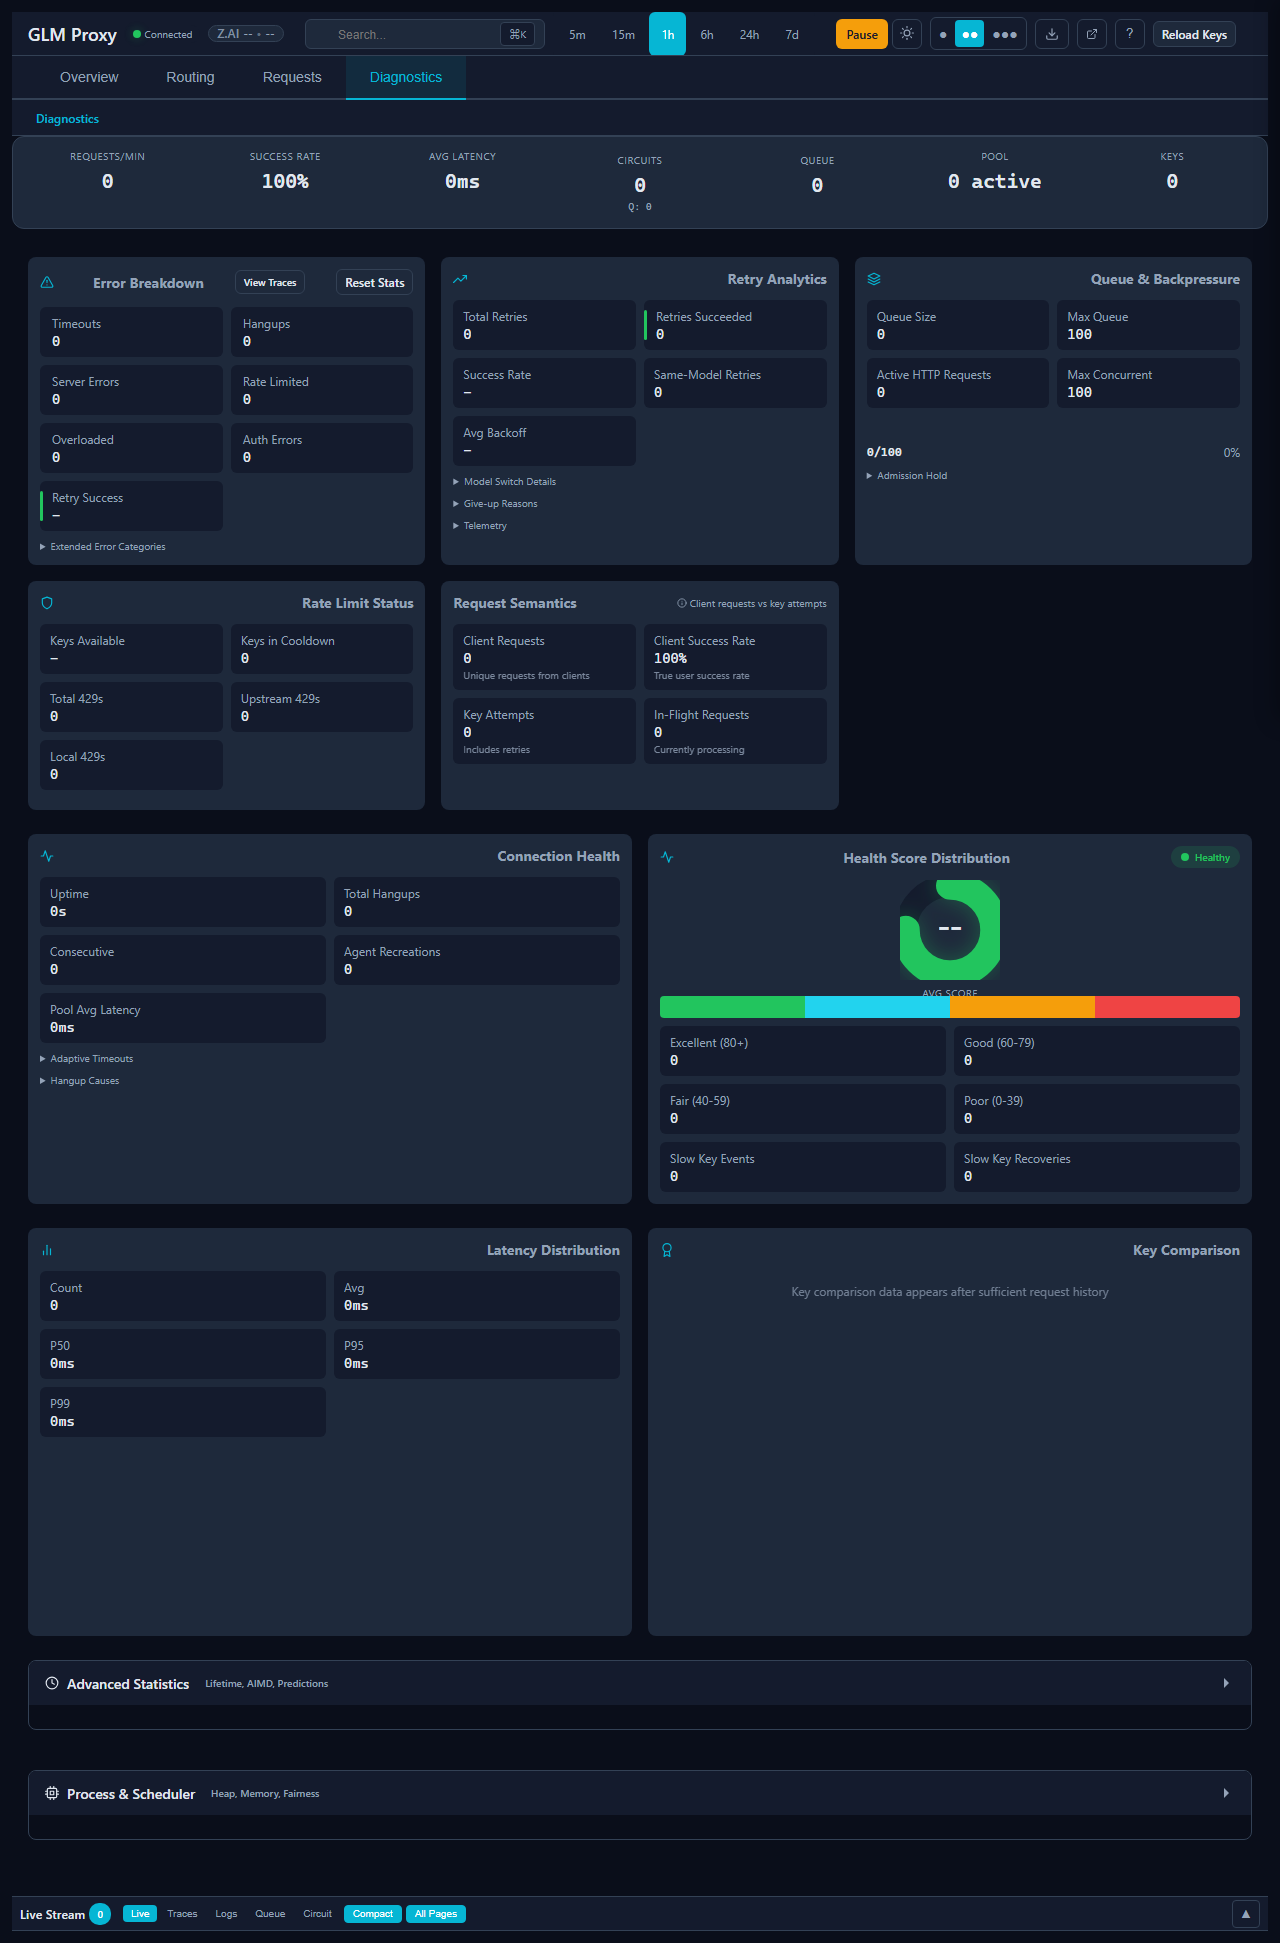
Themes
| Screenshot | Description |
|---|---|
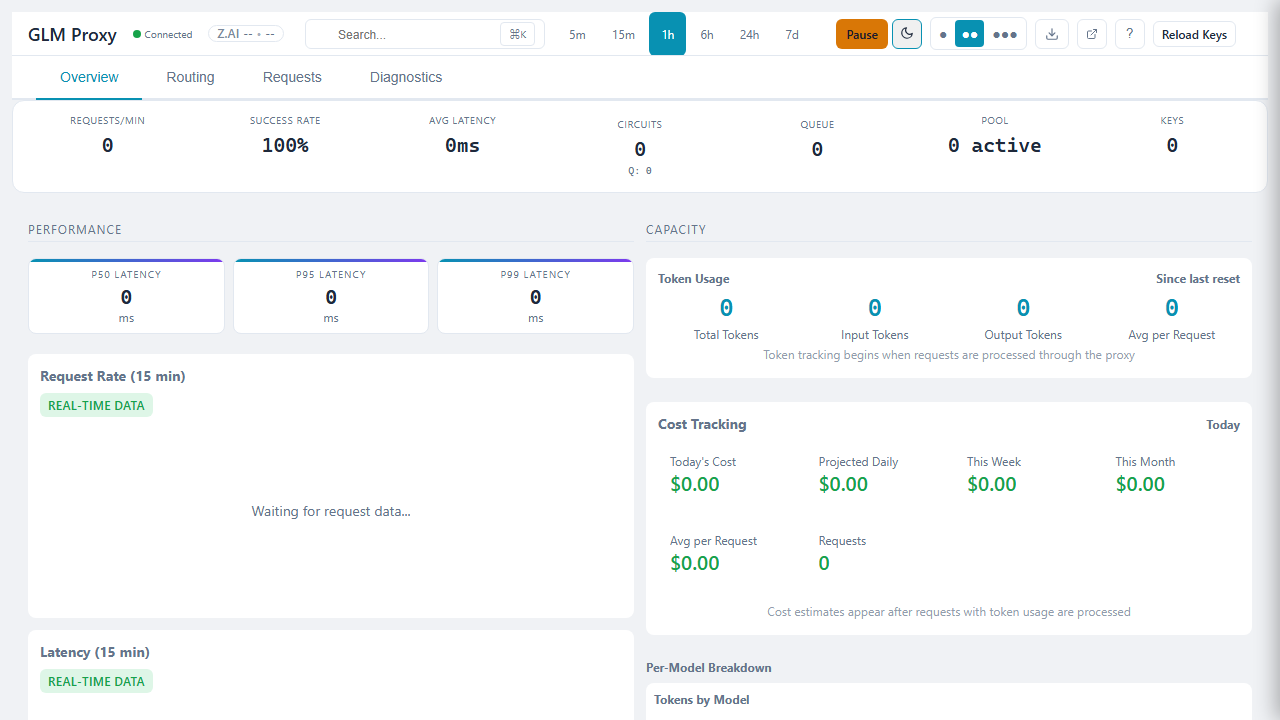
| dark-theme | Dark theme (default) - optimized for low-light |
| light-theme | Light theme - better for bright environments |
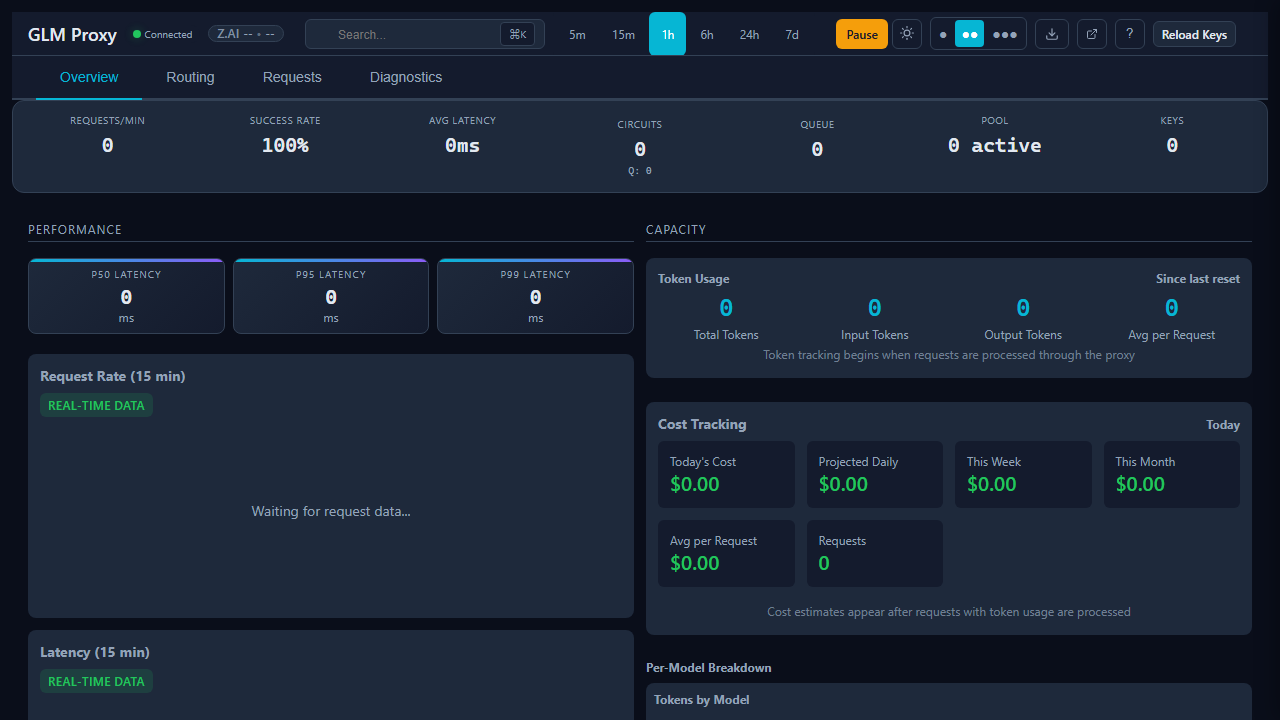
Density Modes
| Screenshot | Description |
|---|---|
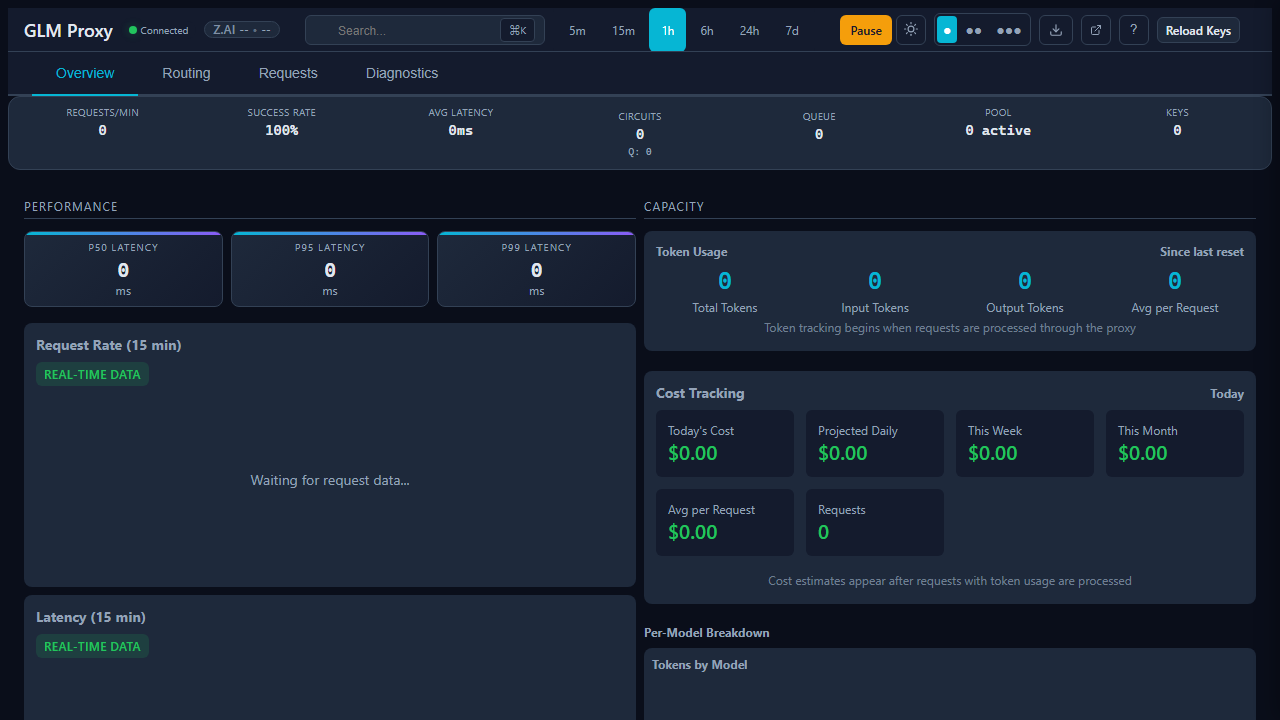
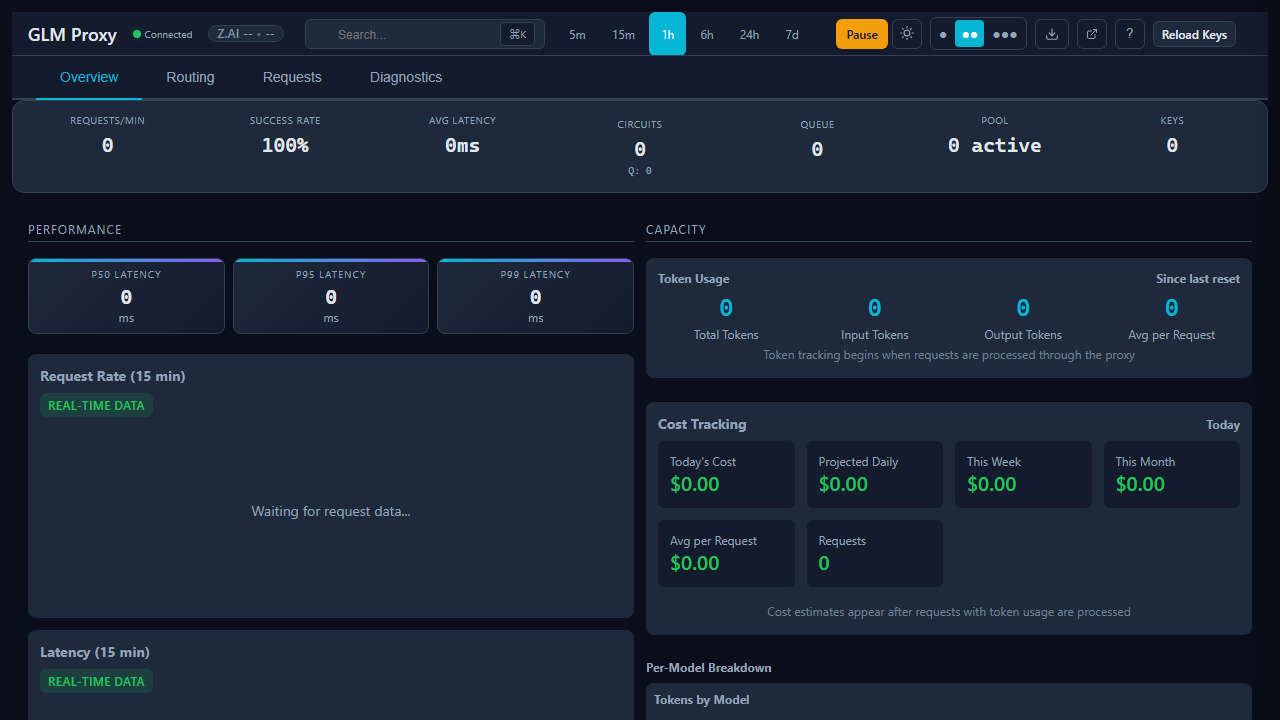
| compact | Compact density - more information in less space |
| comfortable | Comfortable density - balanced spacing (default) |
Dashboard Sections
| Screenshot | Description |
|---|---|
| health-ribbon | Top ribbon with key health metrics |
| keys-heatmap | Visual API key health status |
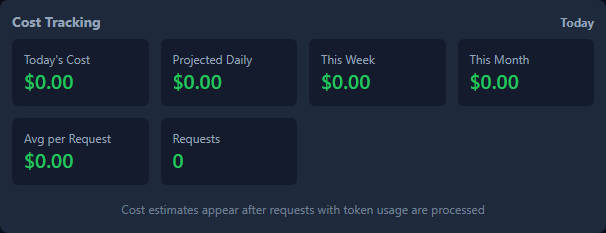
| cost-panel | Real-time cost tracking panel |
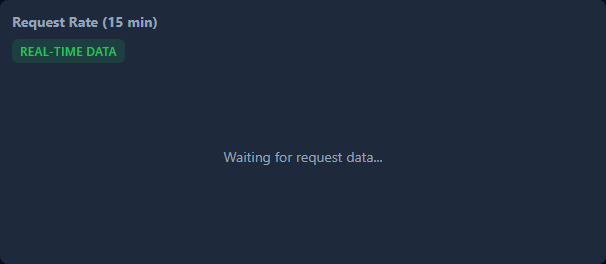
| charts | Request rate and latency charts |


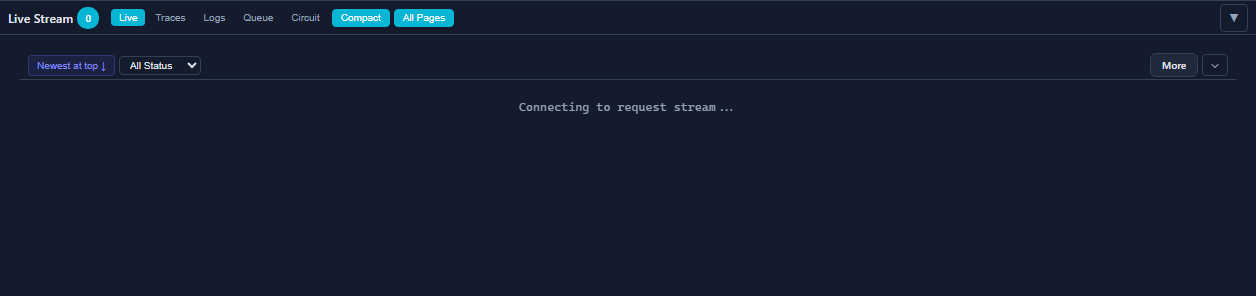
Live Stream Panel
| Screenshot | Description |
|---|---|
| live-collapsed | Collapsed live stream drawer |
| live-expanded | Expanded live stream drawer |
| live-content | Live request content view |


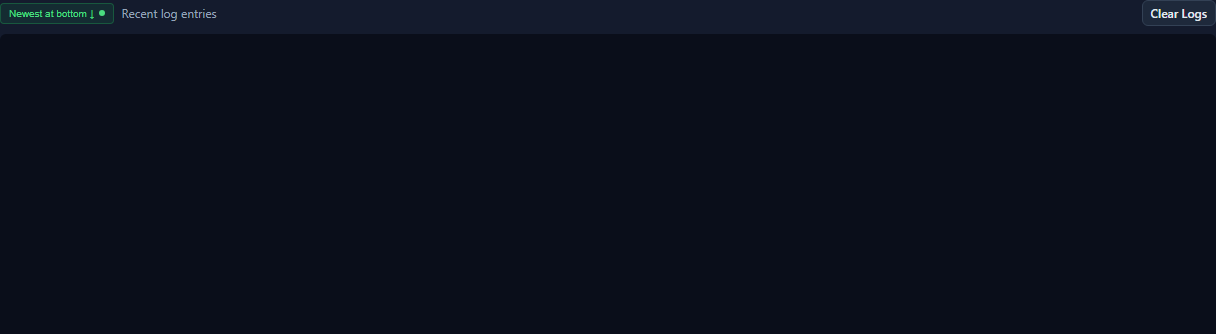
Dock Tabs
| Screenshot | Description |
|---|---|
| traces | Request traces table |
| logs | Application logs viewer |
| queue | Request queue status |
| circuit | Circuit breaker states |



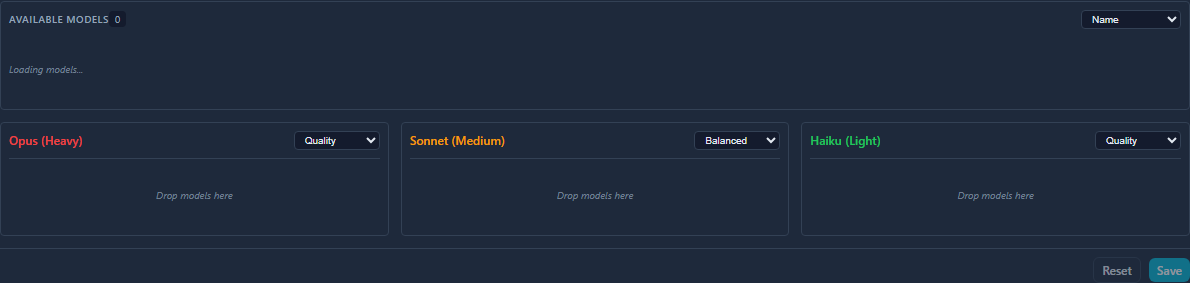
Model Routing
| Screenshot | Description |
|---|---|
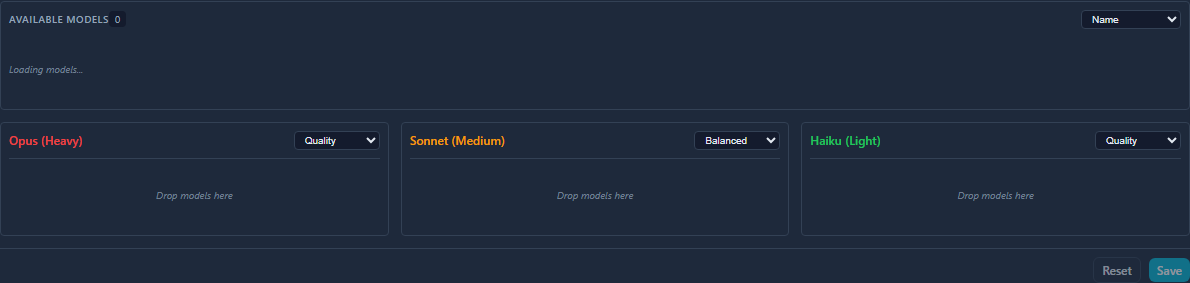
| tier-builder | Drag-and-drop tier configuration |
Modals
| Screenshot | Description |
|---|---|
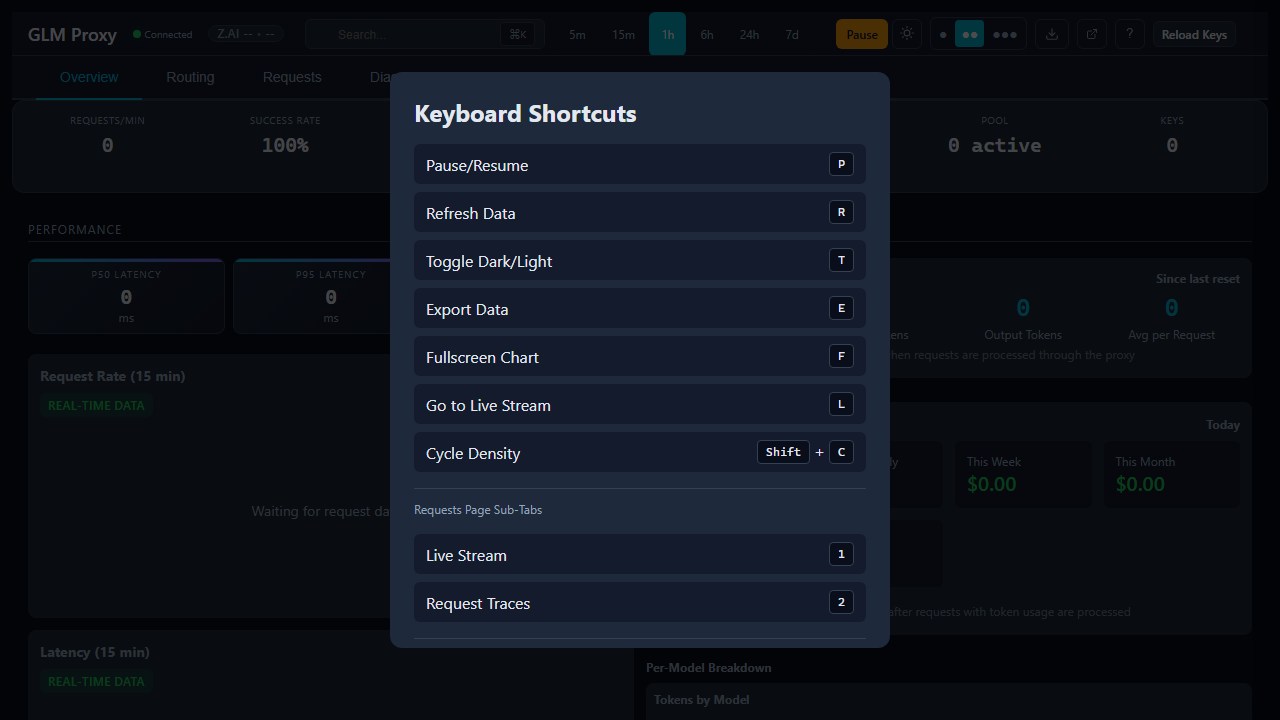
| keyboard-shortcuts | Keyboard shortcuts reference |
System Page Components
| Screenshot | Description |
|---|---|
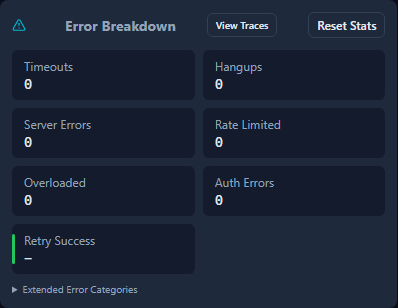
| error-breakdown | Categorized error analysis |
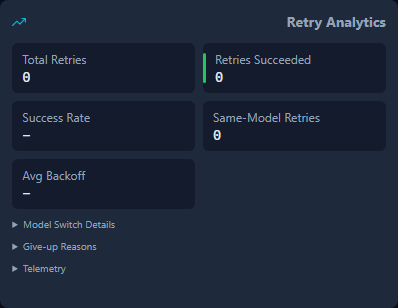
| retry-analytics | Retry performance metrics |
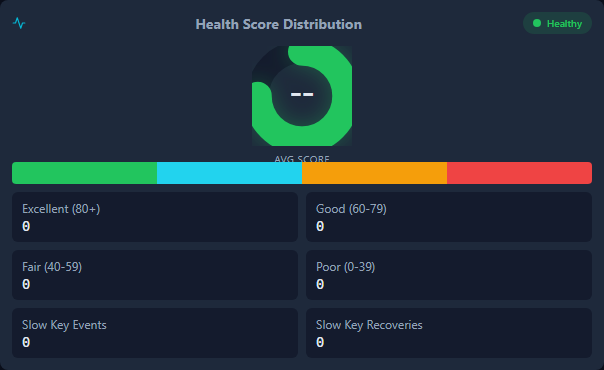
| health-score | Overall system health indicator |
Progressive Disclosure
| Screenshot | Description |
|---|---|
| advanced-stats-collapsed | Collapsed advanced statistics |
| advanced-stats-expanded | Expanded lifetime stats and predictions |
| process-health-collapsed | Collapsed process health section |
| process-health-expanded | Expanded system health details |




Responsive Layouts
| Screenshot | Description |
|---|---|
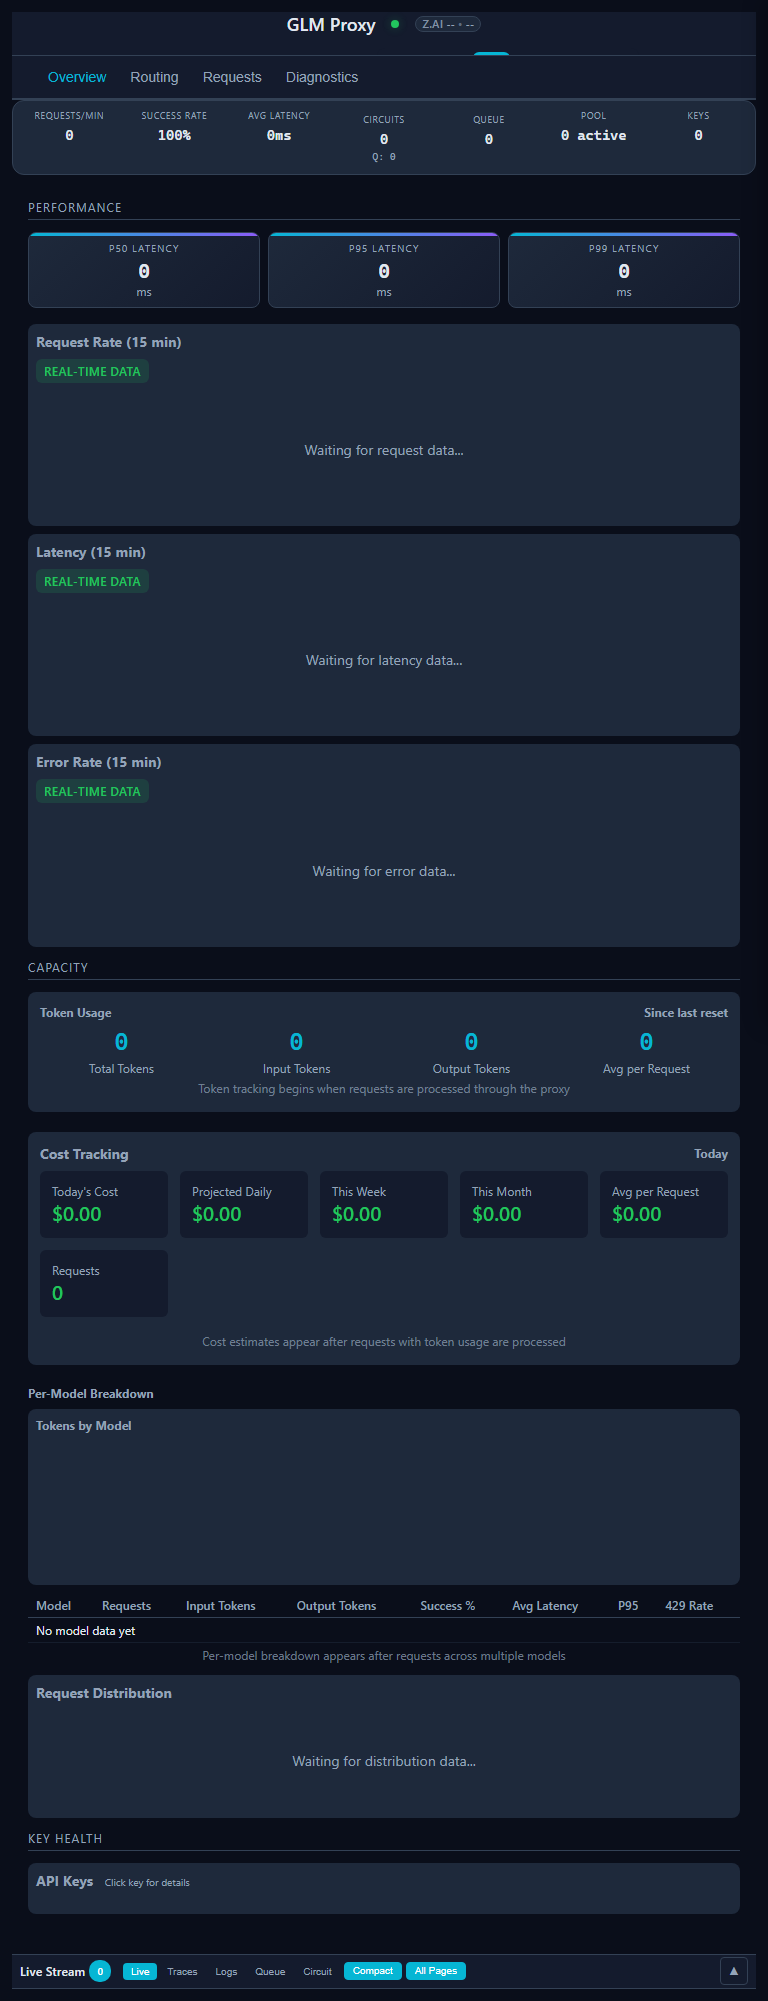
| mobile-375px | Mobile phone view (375px width) |
| tablet-768px | Tablet view (768px width) |
| desktop-1920px | Desktop view (1920px width) |

UI Components (Focused)
| Screenshot | Description |
|---|---|
| page-nav-tabs | Main page navigation tabs |
| theme-toggle | Dark/light theme toggle button |
| density-selector | Layout density selector |
| time-range-selector | Chart time range picker |
| connection-status | Upstream connection indicator |
| pause-button | Proxy pause/resume control |
| keys-heatmap | Focused key health visualization |
| model-list | Available models list |
| trace-table | Request traces table |
| log-entries | Log entry display |
| circuit-indicators | Circuit breaker state indicators |
| request-rate-chart | Request rate over time |
| latency-chart | Response latency distribution |